")
B737max, Air France 447, Asiana 214 – and computer failures reason for the largest flight cancellations in the past two years. Lesson (to be) learned…?
Following a discussion triggered by Airbus’ automated take-off last week, I posted a comment on LinkedIn:
“Just discussed the issue of “autonomous flying”, two examples against it. Asiana flight 214 (there was also a similar incident with Turkish Airlines) caused by a pilot with a semi-religious belief in the Auto-Pilot. Said to have very little experience “flying manual”. And the 737MAX, also to keep in mind the missing redundancy of sensors to safe cost. Also Air France 447 accounted to incorrect sensor readings. One reason I don’t see a “pilot free cockpit”, but a “cockpit flight manager”. Like the flight attendants there in case of need, but usually just monitoring proper systems. “Accompanied” by a drone-operator at the AOC. Having GBAS+GPS a system to constantly monitor the four-dimensional position of the aircraft and if in line with flight plan. If not, maybe a sensor-glitch misguiding the aircraft? Please “Pilot” or “drone operator” override the faulty sensor…”
Several replies, notably the one public response by David Eiser outline the threat: “Too much reliance on automation by both operators and pilots is one of the biggest threats today.”
A frequent issue I discuss when discussing AOC or APOC (airline or airport operations centers) is the necessity to have fallback procedures in case of IT failure! This is also in line with disruption management and the fact that the major disruptions of the past two years were caused not by weather, but IT failures! Just an example reported by Wall Street Journal.
Lesson Learned?
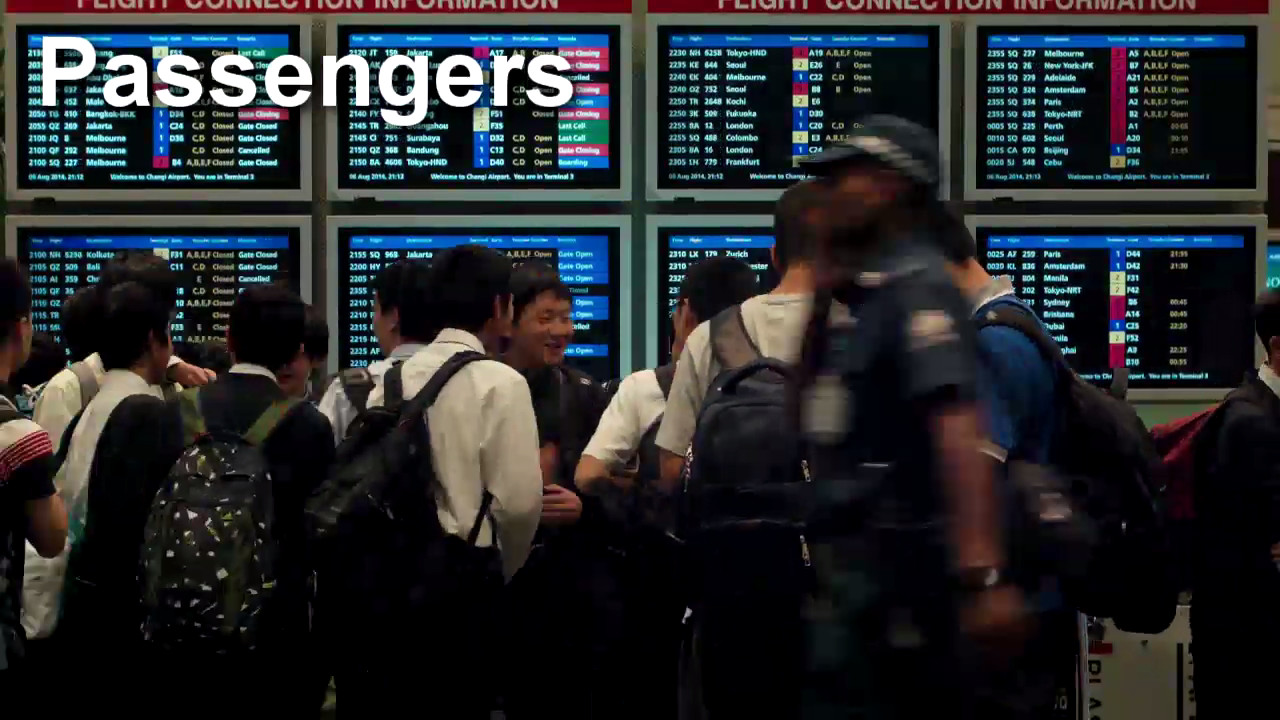
Back in 1990, I came as a Sales person to the Frankfurt Airport to meet and greet an important FAM-group – FAMiliarization – a group of journalists invited for a trip overseas. To learn the flight would not take off, as the airport check-in-system failed. I got a printed passenger list, a stack of boarding passes and after 10 minutes of preparations issued the boarding passes to the passenger. With only 75 minutes into the process the flight got readied for departure. It was as far as I remember, the only flight that left that day during the computer downtime. Lufthansa used a different system, their flights were not impacted.
That was my day to learn the lesson to have fallback procedures in case of a computer glitch. It was driven home over the years by other failures that became public. But more and more, I also learned that managers developed a semi-religious faith in computer systems. Redundant systems cover for a failure, right? Wrong. Working with AOCs and APOCs – there are no system redundancies. If a system fails, there is a downtime. Period.
 Computer Literacy
As Richard Maslen just wrote on CAPA’s Blue Swan Daily: “It used to all be about passes in English and Mathematics, now it is blockchain, cloud computing and analytical reasoning – the changing mix of skills most prized by the business world”. It is another example of the semi-religious faith in IT I talk about. Big Data was the buzzword everyone talked about and nobody had a clue on what it really meant. It’s hip, so it must be good. Now we added blockchain, cloud computing and analytical reasoning. Important buzzwords, but if you look for a business case, it’s for the ones making themselves a business with it.
 Cloud Computing
Did you know that aviation was the first large application of cloud computing? Sabre enabled to book flights from anywhere in the world anywhere in the world. I used Sabre-messages back in 1987 – that was years before e-Mail. Tell me about Cloud Computing. On the backside, most recent computer failures forcing airline downtimes were caused by small cloud solutions failing and taking down the airlines’ IT system as a collateral damage. Leaving airplanes grounded, passengers stranded.
Blockchain
Where aviation has a strong requirement to keep a “history” of changes in their IT systems, blockchain might help, but it adds complexity and slows down systems. And keeps the question of the ultimate truth. If there is a data discrepancy between two independent systems, which ones is the right one? That’s not just on A-CDM between different stakeholders, I’ve seen the same problem arise on internal systems aplenty!
Analytical Reasoning
Now on analytical reasoning, it goes with the old issue of who analyses with what intent. As the old saying goes, I only trust the statistics I falsified myself.
 Aircraft System Redundancy
Now have we learned our lessons? Speaking to academically educated managers, I find a lot of superficial knowledge. Like the Big Data picture. Someone – usually the IT companies – come up with those buzz words and explain they are important. They are not unimportant. But it boils down to my usual question: Give me a business case. No wishful thinking. Nor divine revelation and forget what the stars foretell!
Boeing managers, in what I consider a criminal neglect, prioritized commerce over safety. In line with FAA and others. “Shareholder Value” is a word that was invented in the U.S. It implies that the only value a shareholder has is short-term profit. I disagree ever since I learned the word back in 1997 in the process of the IPO of Cytric. At the time my baby – yes, the one today owned by Amadeus. Shareholders have different values. Long term profitability. Sustainability, not even linked to profitability. An idea. Something “good”.
Now Boeing used a single sensor to trigger MCAS. And the system overruled the pilots. It crashed two airplanes. The cause? Greed. A mortal sin.
 Faith in The Computer
A key-finding on Asiana 214 was a pilot who believed in his on-board computers. Who had thousands of “auto-pilot” hours, but very little experience in manual flying. Who did not grasp that for a wrong sensor his system was wrong. Who made small mistakes on his computers’ settings (i.e. direct input, no landing flaps) ignored the tower’s advise to do a turn-around, to disrupt the landing and start the landing process anew. A similar case grounded a Turkish Airline plane. Pilots like this make a case for autonomous flying. Better a stupid computer than a pilot with blinders.
Another sensor failure caused the crash of Air France 447. GPS giving a three-dimensional point in space, where are the systems that provide that information to the pilots at night? How can it be that pilots and airplanes loose their direction in the air?
And while we talk about GPS and GBAS in aviation, a flight like MH 370 teaches the same lesson. Not the one shot down over Ukraine, but the one that got lost over the Indian Ocean. Airline and authorities are blind over the big oceans. All those fancy systems, satellites, etc. and we have no information, neither in the cockpit nor at the control centers, where the flights are? And trust in pilots following navigational directions (semi-)blind?
Faith in the Pilot
A frequent argument for the cockpit automation is German Wings flight 9525, where the pilot flew the airplane into the mountain. While that was a freak incident, neither pilot nor computers are “fail-safe”. All we can do is to minimize the risk. And while autonomous flying will come, I’m an advocate for a “flight operator”, both in the cockpit, as well as on the ground. Then we have three independent “systems” and any two will override the third. Still, there will be ad hoc decisions to be taken, then who “rules”? If you have another aircraft on collision course. If you have foreign object or another aircraft on the runway.
 Fly by Wire, Drones and Air Taxis
Since the development of Fly-by-Wire, airplanes cannot fly without computer aid. If the computer fails, the steering signals from the side stick go nowhere. So we already rely on the computers in airplanes. And a computer failure will result in a crash. Period. But Fly-by-Wire also makes the case for automated flying.
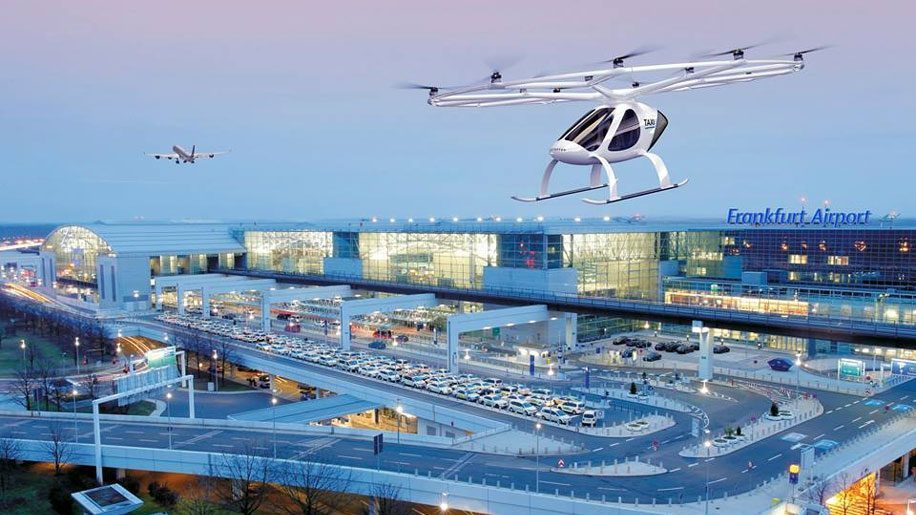
Pilot-less air taxis already require a fully automated system. If you consider them to fly in airport vicinity, they interact with the flight plans of commercial airplanes, today considered a major security risk with an excessive bureaucracy for a single approval for any plane, helicopter or drone entering the airport’s air space!
 A similar case is the automated drones as envisioned by Amazon, DHL and others, for automatic passenger delivery. As the air taxis, they will rely on a fully-automated flight planning and flight plan filing with the authorities’ computers. Simply to avoid in-air-collisions.
While commerical airplanes, delivery drones and air taxis follow pre-assigned flight plans and routes, drones are operator-guided… Can we expect manually guided drones in the air space of other operators? Be it air taxis, helicopters or airplanes? I doubt it, I believe this is a short-lived fashion. Soon drones will be so restricted in use that they go back to hobby and in pre-assigned areas. All other operations requiring the filing of a flight plan!
I like the examples in The Fifth Element. Or Doctor Who’s episode Gridlock (image). We’re not talking about individual travel or we risk air accidents, way more potent than any car accident you might imagine today! This can only work in a fully automated environment. You want to change your flight plan? The computers must secure a safe route in four-dimensional space – including the time, beyond what ATC can do today! A constant prediction of traffic for several hours ahead!
My Prediction
I take it with Heinlein, as he wrote in Friday, a 1982 novel. I believe we will have ability for a fully automated flight, which will also improve A-CDM and flight planning. We will have a pilot on board. Plus a drone-pilot in the AOC. Heinlein wrote that the pilot no longer pilots but is there for the sake of passengers’ reassurance. The pilot unlikely to have better ideas than the computer.
The pilots will be turned into a flight operator in the cockpit, plus a flight operator on the ground. Both will be specialists, but I predict that their “work times” will no longer be privileged, but more like computer specialist. Automated flight management will reduce the work load and make those jobs mostly observational. Making privileges in duty times or salaries obsolete. Heresy. To the pilot industry. But in my opinion a “logical consequence” since the introduction of fly-by-wire – which also was the start of the discussion about autonomous flying.
Side note: This will also automate Air Traffic Control, ground handling, etc., etc. – Give take 100 years, likely less, we will have air traffic automated. With very limited manual input by pilots or other stakeholders. Backbone is slot management, scheduled flight planning. Then add “scheduled air-taxi” (air-bus), followed by delivery drones (for people or freight), ad-hoc flights. Think about medical emergency but also “VIP” flights (Air Force One)…
Food for Thought!
Comments welcome

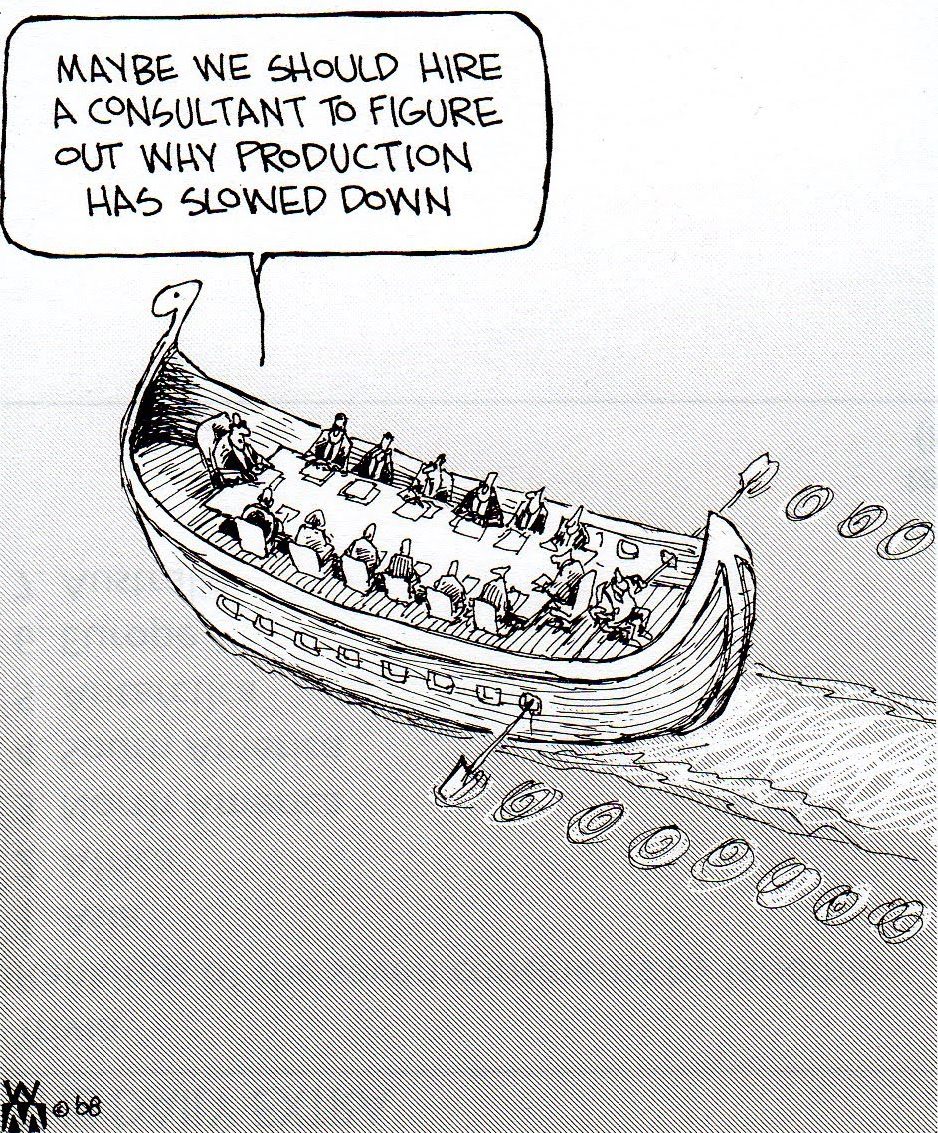
 For outsourcing, it is very similar. If you have little need for a certain specialization, you outsource to experts and consultants. That can be i.e. tax management in small companies, HR, IT, etc. In this case, it is less about consulting, but about consolidation.
 Cloud computing is another area of (IT) outsourcing. It follows the same rules. So if you are a very small airline, you will likely take Commercial of the Shelf (COTS) IT-solutions. You use some passenger service solution (PSS), an OPS system, the airports’ check-in management system, etc.
 The main reason, I see consulting, outsourcing and cloud computing critical is the development of information silos. Not you own the important information, but “someone else”, someone outside your company. It can be a consultant, it can be a service company or an IT-system.
 My first experience with cloud computing was Sabre, Amadeus, but SAP was my personal experience with the SAAS model and it’s most negative repercussion. Good for the software provider, bad for the user. You bind yourself to the ecosphere of the software provider. For good or for bad. To change later is being made so difficult and expensive, it’s virtually impossible. Where the data might still be available, the computing “rules” are mostly not, you have to reengineer from scratch – there is a big consulting industry out there, specializing on such jobs, usually not talking about thousands in cost but millions.
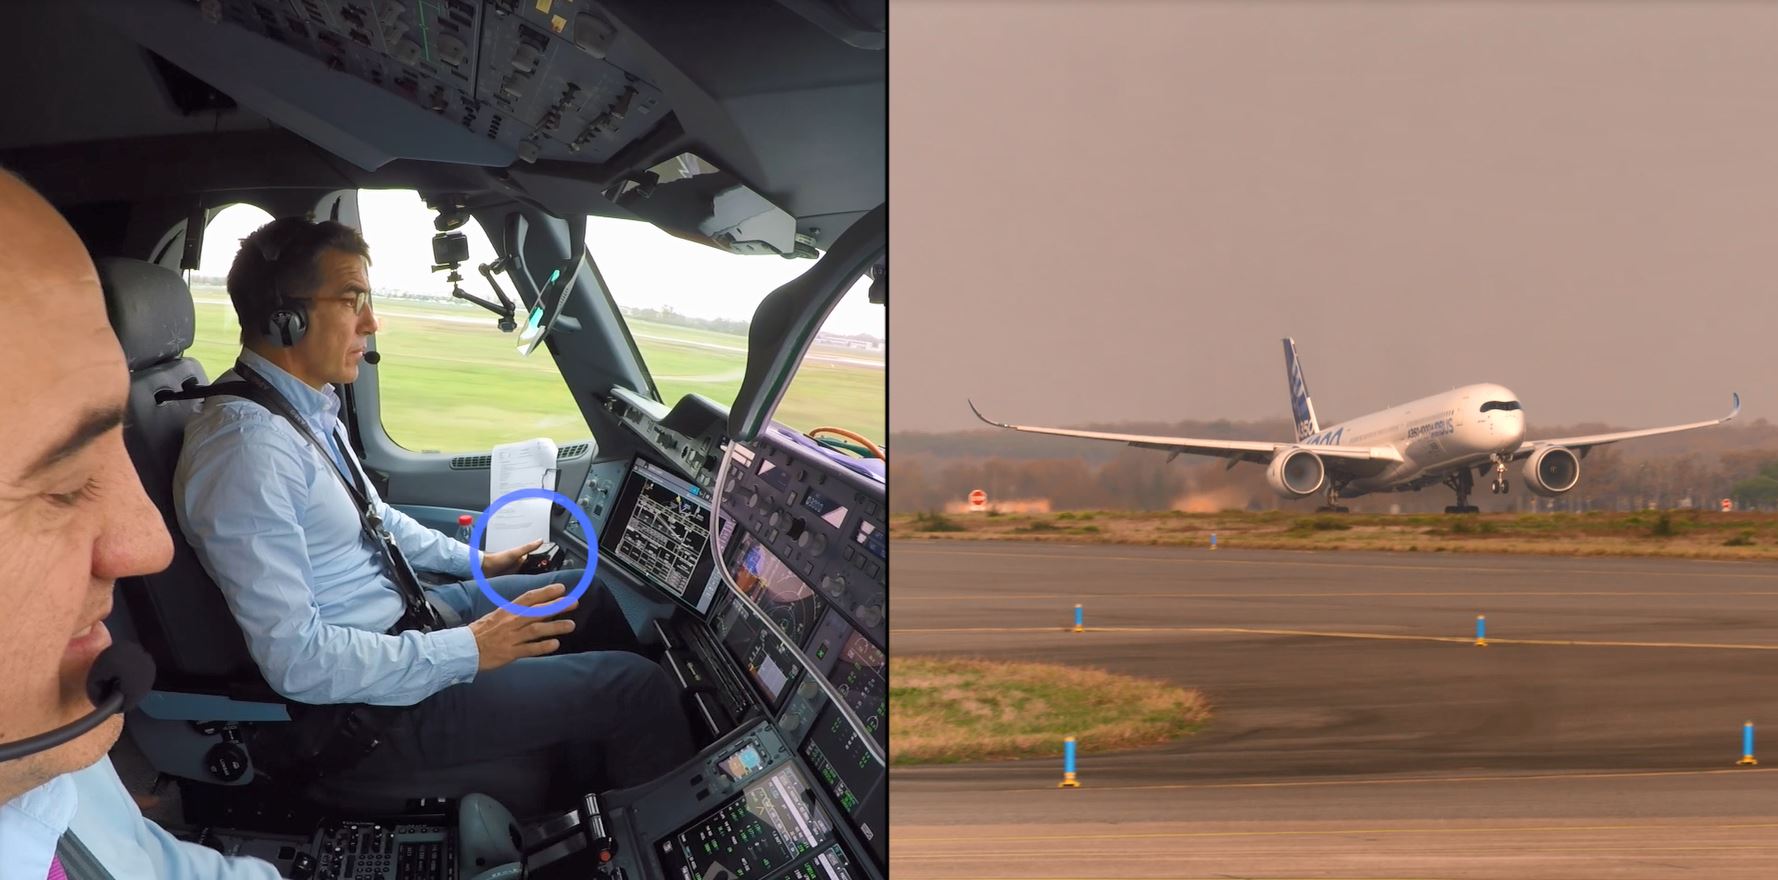


 BlueSwanDaily believes in the future of
  I myself worked out a “green” concept a few years ago, but we’re neither getting there… The project got grounded in the wake of Lehmann Brother’s and a world financial crisis and the original interested investors gone never took up speed again. [Update: The Korean
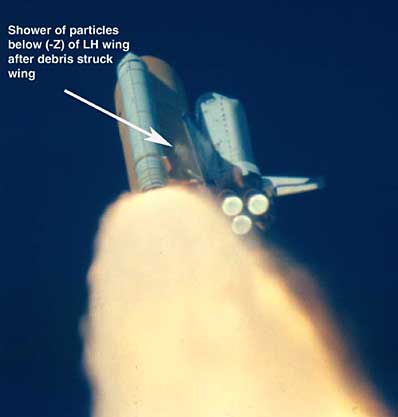 Later I learned the same lesson from space shuttle Challenger, management ignoring their own experts warning them of the temperature being below safety specifications. Shuttle Columbia dying of a piece of foam worth a few cent perforating the heat shield. Of Concorde crashing from a “minor” piece of scrap metal.
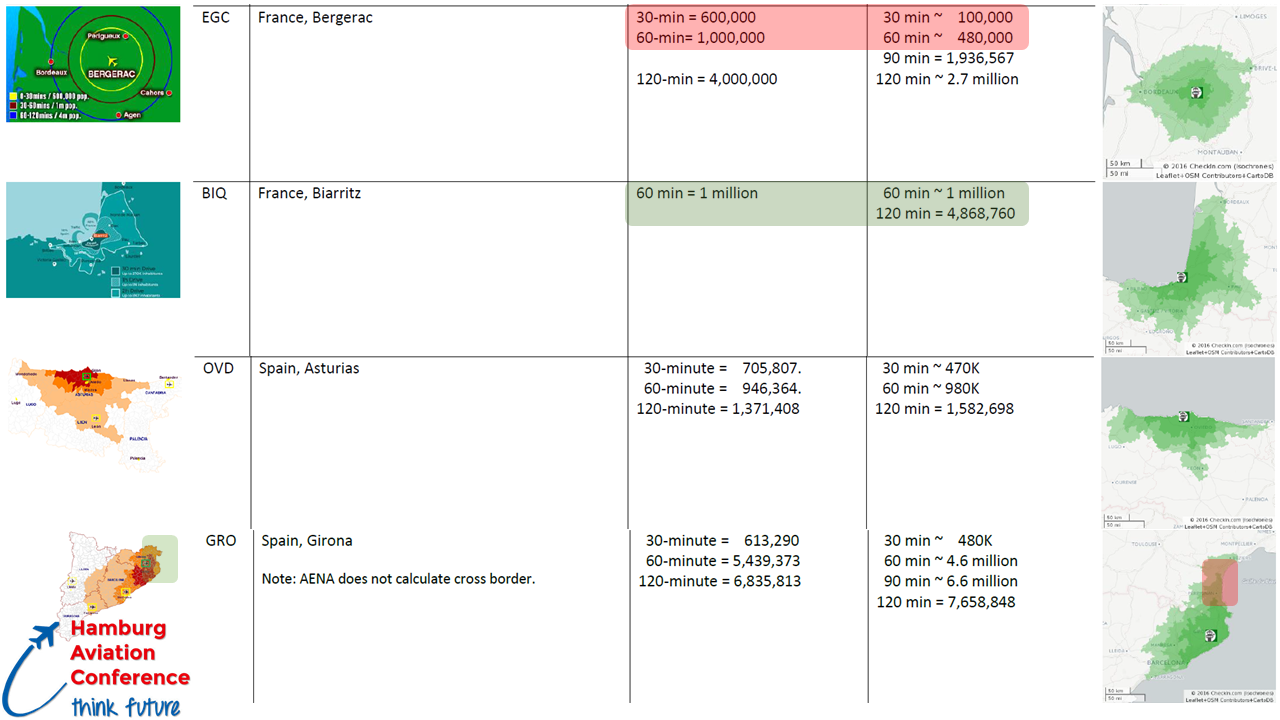
 So we also had a look ourselves into the “route data”, getting statistical data from those other routes from Eurostat (avia_par), the airports, two of the tool providers, as well as three airlines. As discussed in
 Coming back to the issue of this post. My airline friend and I discussed for several hours (thank you!). And rather at the end, he emphasized, why he invests only little time in “analyses”. Because all those analyses will promote the big buddies. They will confirm business potential on the large airports with data silos full of supporting statistics. But they will disqualify any of the small airports solely based on the fact that there are no “supportive statistics”. Following our discussion, he wrote me a very short message: “Jürgen, the game is rigged. Your catchment area stuff is the first thing I saw to give me a somewhat unbiased view on smaller airports in years. Those [other] analysis tools are sold to sell us statistics. Stupid network planners and the ones trying to play it safe and by the books, requesting the QSI. It’s why mostly the small airlines, who can’t afford those tools start new routes.” And why he emphasized to me that he and anyone in his team wouldn’t bother about any route viability studies based on the statistical history of the airport, except for an indicator. “If you play it safe, you just follow the crowd.”
![“Our Heads Are Round so our Thoughts Can Change Direction” [Francis Picabia]](https://foodforthought.barthel.eu/wp-content/uploads/2021/10/Picabia-Francis-Round-Heads.jpg)
 The last weeks were rather challenging. Speaking at Passenger Terminal Expo on Data Silos, Silo Thinking and the need to Tear Down the Walls, Yulia and I also worked on the update of the airport passenger statistics, adding movements to the database to expand our information. And we fell right back into
 ANNA.aero maintains what they call the
 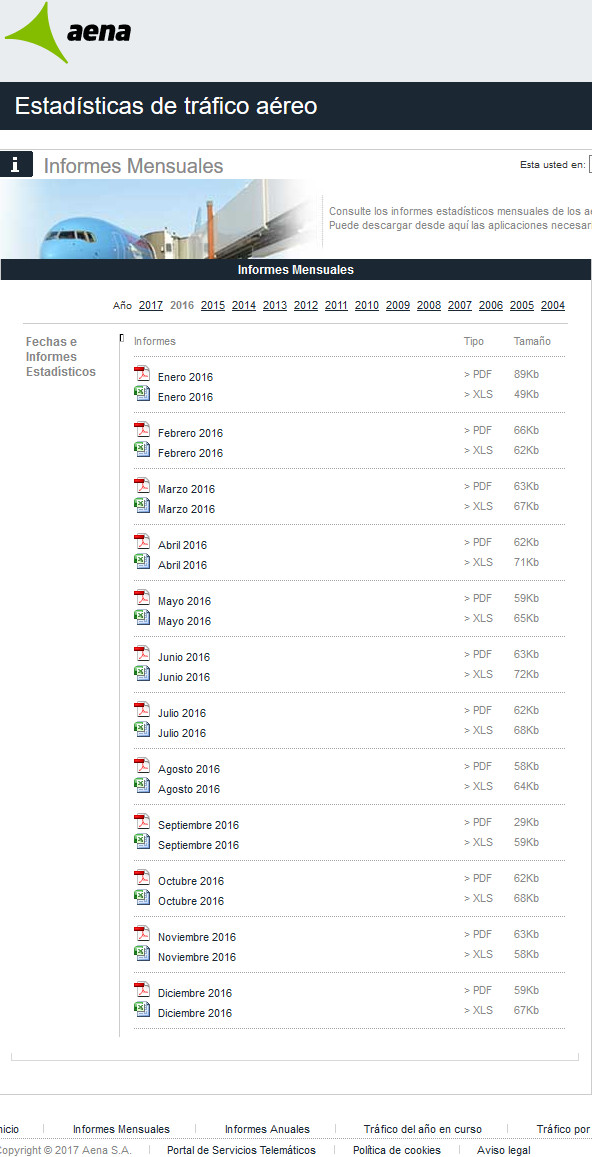 We find several sources for public accessible data. Sometimes you find it on the airport’s own website, somewhere in “Statistics”, sometimes in a press release, usually not in one, but in 12 press releases (see image). And even when publishing the annual numbers in one file, the file comes as a PDF, formatted that they cannot be extracted into a table but copy into one value a line. On a complex table, that renders that useless. So the airport forces users of their data to write the data off the PDF? You can’t be serious, can you?? Sometimes national airport associations publish the data, usually monthly. After we found them to occasionally change the formatting and order even within a given year, we double-check that on the import, burning valuable time. Then we learned to now download monthly data before the annual one was available, as we also happened to fall the trap of intermittent changes (see ANNA.aero). Many such files do not contain the airport codes. But the airport name in the national language. Upper case. No, that does not compute easily and is prone to cause data errors.


 Mark from OAG directed my attention this week on OAG’s Punctuality League, which they offer for free
  It can only be an indicator, as both sources fail to relate the one to the other. My first question would be to correlate the on-time performance to the hub airlines. Because it is utterly unfair to blame an airport, if their major hub airline is notoriously late.
 At the same time you work with big data, so the more data you work with, the more vital it is to get them from a sound source and have them integrated into a common system. Whereas most established data providers, be it OAG, Flight Stats, SITA, etc. have not yet addressed that for a “good reason”. But as an industry, it is vital we add this and integration is very high on our back log at CheckIn.com of what we where we want to go!
 So. Why do I give these on-time-performance, no those delay statistics so much thought? Aside the cost of delays summing up to millions, they are not just a nuisance, but a problem. Because when I did that additional case study on cost savings, based on the


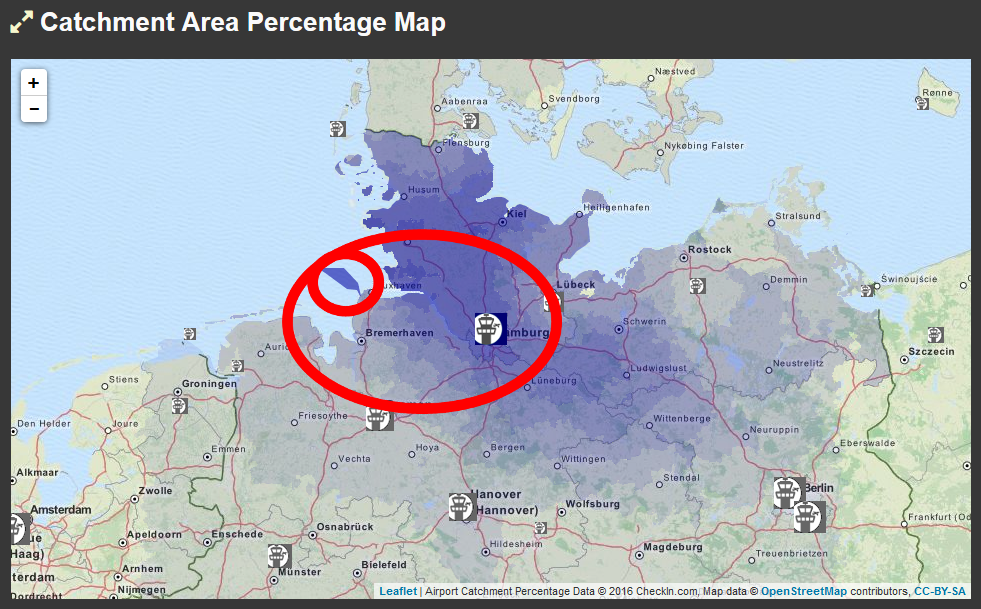 Another bug we have in our backlog and work on constantly (it’s “relax work”) are the city centers. We calculate population based on the municipality. Now municipality borders are nothing really easy to use for mapping. Take the example of
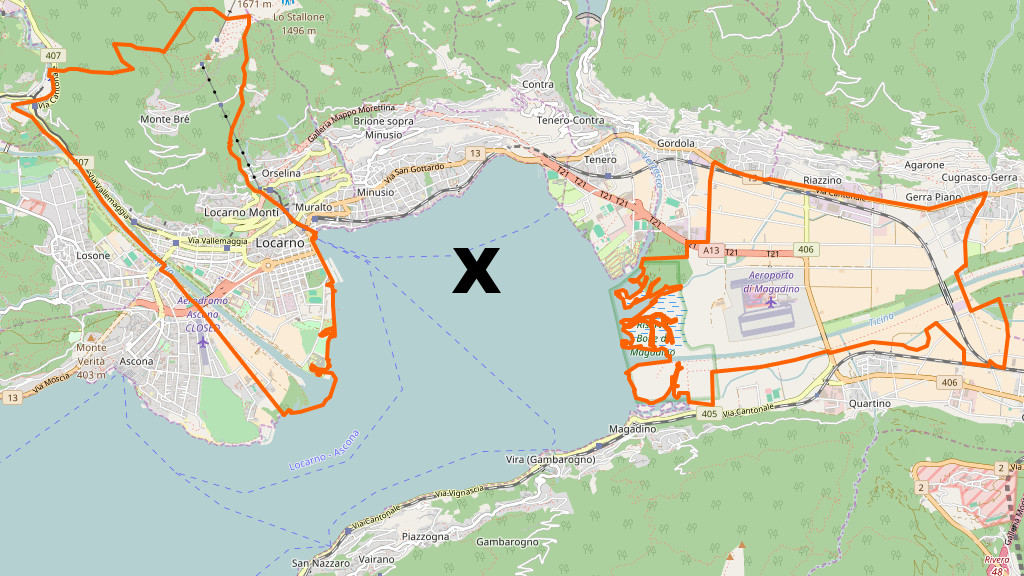
 And don’t underestimate that the population for all those municipalities we have on file are not the same coming from Eurostat, national statistics offices or the towns themselves. The naming differs between those sources and there is no “common code” like we have in aviation, to uniquely identify those towns. That likely also being the cause of the +20% mistakes when using that commercial maps provider (€32K) for drive time calculations that caused us that ad hoc map change earlier this year. Little town Münster, Bavaria is not the large city Münster in Northrhine-Westphalia the commercial mapping provider returned. And is that now Münster, Bayern or Munster, Bavaria or Muenster (Lech)? Worse in France I can tell you… So we had to make sure we only use geopoints and not unreliable “names” and maintain an extensive list of “associations” to make sure we have the data properly associated – until the next update when they changed a lot again.
 So we take into account the airport size by passengers, defining (assuming) the “reach” of the airport. That’s also something variable, as in some areas there’s a lot of large airports (i.e. Germany to BeNeLux), other regions, airports are rather scarce. Spain for example has Madrid in the center and except for two minor airports all other airports are on the coast. To Bucharest a substantial number of people drive eight hours. We calculate ferry times, including standard waiting times, but what about ferries that go once a day and then you have 18 hours to wait for next days (once-daily) flight?
 Quo Vadis?