Following my leave from SITA, Yulia and I have now launched CheckIn.com accompanied by a press release promoting the new services.
We are still in prototype stage, but are confident to cover Europe by Routes Europe.
by Jürgen Barthel
![“Our Heads Are Round so our Thoughts Can Change Direction” [Francis Picabia]](https://foodforthought.barthel.eu/wp-content/uploads/2021/10/Picabia-Francis-Round-Heads.jpg)
Following my leave from SITA, Yulia and I have now launched CheckIn.com accompanied by a press release promoting the new services.
We are still in prototype stage, but are confident to cover Europe by Routes Europe.
 Following the acquisition by my employer delair by SITA, I was not allowed to maintain a personal blog until our parting of ways in February 2016.
With centralized communications, employees are not encouraged to run personal blogs or activities that are out of the control of the company. To my personal believe and in hindsight, it is an example how SITA uses the new communication channels: They’re stuck in the Industrial Age type and hold on to supply-driven information:
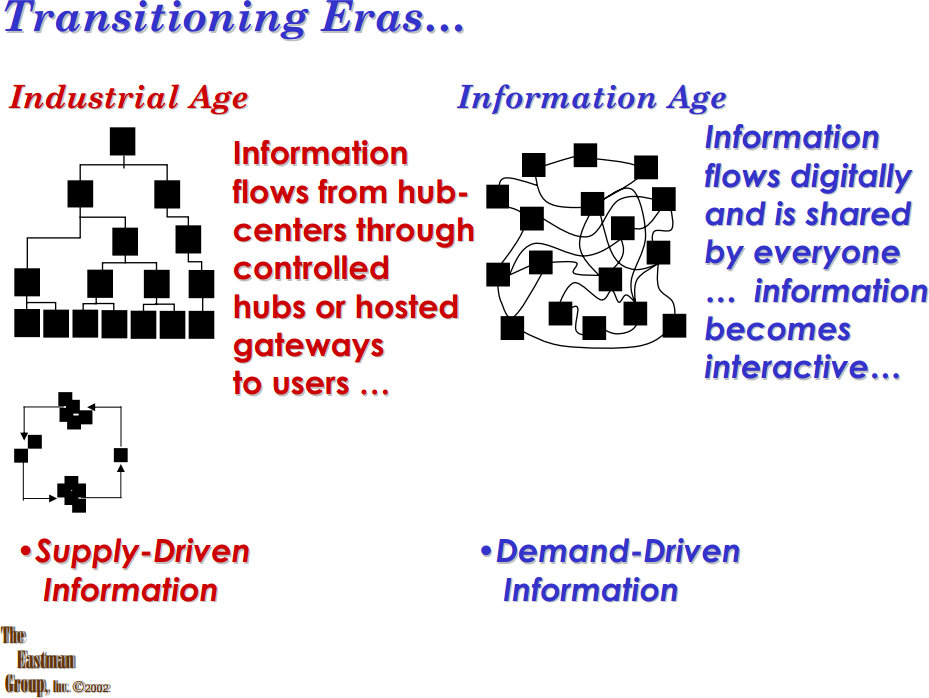
We push, because “mother knows best”.
Discussing Airport Development on a general and global scale lately with some renowned influencers in this industry, there were some thoughts, I would like to share today.
 Who’s the Customer?
It was rather fascinating to discuss the “customer” issue with airports recently. Though despite we all know that we compete about the passengers, the airline is just as much a customer of the airport as are ground handling companies. As we published in our case study on Zurich’s new deicing management, one of the main cost savings factors, reflecting millions of savings (Euro, Dollar, …) comes from reduction of delay, faster recovery from overall delays or disruptions. With passengers and airlines alike benefiting from “pre-tactical” information.

or why only the dead fish swims with the stream? There is a great tendency in our industry today to wait and see “others” and especially “the big ones” to invest in new technologies and try them. And only with many years of delays implement the investment into the own budget plans and maybe get it year(s) later. Be that the use of (free) WiFi at the airports for all customers or CDM developments to the benefit of airport operations – especially under adverse conditions.
 Saving, no matter the cost
A common argument against the investment is that the status quo functions. Airlines are i.e. “used” to have major delays during and after winter events. The throughput is lower, flights must be cancelled, after disruptions, the recovery takes time. Zurich having saved +20 million Euros in one season alone by “managed” deicing is a good counter example. With other airports/airlines stalling the implementation of the tool for their airports/terminals “for cost reasons”. Sorry, I will never get used to burning the amounts of money our industry does. We invest into “customer experience” but don’t bother about reducing flight delays.
 Collaboration vs. Silo
The global Civil Air Navigation Services Organisation (CANSO) and the Airports Council International have declared Airport Collaborative Decision Making (A-CDM) a management matter, joining forces in the promotion of the concept. Now airports and airlines alike keep pointing out that they have no common data. A major U.S. airport disqualifying it with the example that they don’t even get an Estimated Time of Arrival (ETA) or Departure (ETD) from their airlines. They learn of arrivals or departures once the aircraft is on approach or on engine start-up or pushback – thanks to kind information by the tower. The operator of a terminal at one major hub tells us, collaboration won’t work at their airport as the terminal operators strongly competing. Yes, there are workarounds possible (considering the controlled apron/tarmac area “the airport”), but as long as airlines and ground handlers keep up such self-understanding, we are a long way from “effective operations” or even a basic management of delays, disruptions and recovery.

In the discussion, we also talked about airport strategy. New airports are being build without giving consideration to A-CDM or TAMS (Total Airport Management, expanding A-CDM into the land side), but focusing on fancy design. (New) Nordic airports having trouble with the positioning of their deicing pads (also called “Central Deicing Facilities” or CDFs). Space for an “Airport Operations Control Center” (APOC) being later taken from existing office space, instead of pre-planning the necessity. Airport Operators like Avialliance, Vinci or even Fraport (a CDM-airport) focus on CDM locally, instead of considering solutions that improve the airport group. Just some thoughts on the issue as we discussed it and I joggled down my notes…
Food for Thought
Comments welcome
 Just screening all those wisdoms my friends keep sharing on LinkedIn and Facebook, here one from own experience…
People do not want to admit mistakes.
Developing online booking tools back in the 90s, when no-one (especially not Amadeus, Sabre, etc) believed in it, I learned that lesson good: Business travelers wanted to make the bookings with their travel department. But they wanted to CHANGE the booking themselves (online). Asked, why that is, it was simply that they considered the need to change a booking a “mistake”. No matter if the change was enforced to them. It also showed how important it was to them to keep face with their travel arrangers.
Food for Thought
Comments welcome
![]() Braunschweig, March 2015 Thanks to unforseen circumstances, the last days forced us to reconsider the entire development and timeline for the CheckIn.com project. So far, it was planned to be ready with development by February, Mid March and prepare for rollout at Routes Europe in April in Aberdeen. We have now decided to cancel that event overall, a hard and unhappy decision! But. Especially to digg out the U.K. statistical basics caused us major delays, getting incompatible figures from the same source, not just self-researched but also from the ONS (U.K. Office of National Statistics). We learned they mostly only cover England & Wales, neither Scotland or Northern Ireland. Sure with exceptions, which, if you’re kept unaware, simply cannot compute!
Braunschweig, March 2015 Thanks to unforseen circumstances, the last days forced us to reconsider the entire development and timeline for the CheckIn.com project. So far, it was planned to be ready with development by February, Mid March and prepare for rollout at Routes Europe in April in Aberdeen. We have now decided to cancel that event overall, a hard and unhappy decision! But. Especially to digg out the U.K. statistical basics caused us major delays, getting incompatible figures from the same source, not just self-researched but also from the ONS (U.K. Office of National Statistics). We learned they mostly only cover England & Wales, neither Scotland or Northern Ireland. Sure with exceptions, which, if you’re kept unaware, simply cannot compute!

Scotland does not cover the Local Administrative Units Level 2 of Eurostat, they consider those useless and calculate “something” only on demand. Ireland came last (by end of February) and again with non-standard numbers we now have to “make compatible”. To qualify the difficulty to get the basics for the U.K.: Covering geographic Europe, including Balkan countries and other non-EU countries, the U.K. made it a multitude more difficult for us to get some useful information.
 Another issue is drive times, where we have to deal with the fact that “unique administrative places” are not being found either in Google, nor by other on- and offline mapping tools. Often, road data is missing completely, making it impossible to calculate any drive times. Especially going east that caused us quite some headaches (and night shifts). So now finally, though with already some delay, we have everything covered. But we recognize that “mapping” is a major fuzziness, if we go with existing technologies – we should buy into commercial collections of administrative borders, though which also don’t completely match with the data we are having.
 So January 1st, we started the crowdfunding on Indiegogo, hopeful to get enough interest to finance the necessary development. Generating interest and funds mostly from unexpected sources, by early February our hopes shattered, our friends leaving us out alone in the cold. Very little buzz, not even supportive comments to us, even from our close friends, ad sure no orders for Isochrones. A real nice classic barrel burst. Simply dead silence. Not a bad thing, in fact it confirmed our initial approach to go in a step-by-step process, fund as we can, do what we can, but not to rely on investors (requiring fast return-of-investment, having their own agendas) and do “ourselves”.
 Then came the shock. Within days, Jürgen went into sickleave, undergoing a major surgery Feb 27th, taken completely out of the loop for the better part of 14 days and being still hospitalized (4th week), depriving us from the most knowledgable and networked expert in our team. He is well now, still recovering, still hospitalized. The tumors identified turned out a haemangiome (as “known” since 2002) and a benign neuroendokrineous one.
So after recovering from the major surgery, he shall be almost as new (minus half a pancreas, the spleen and a bit of his liver and plus a possible diabetes). Celebrating his 50th birthday recently, he feels “old now” thanks to the fact that for the remainder of life he got to carry a pillbox and injection pens with him to cover for the lost half pancreas.
But the main setback is the delayed recovery; instead of the expected 10-14 days we now talk more about min. 4-5 weeks that we lost his support for. With all that baggage, we were faced with a tough decision. Do we keep up the plan to go live at Routes Europe? Or do we have to postpone? Especially with the desinterest showed for our crowdfunding, the missing funds to secure external development for the remaining solutions, problems with providing a solution for maps now and Jürgen’s missing help, we decided against Routes Europe and for a delay.
 Having the drive time calculations completeted for Europe, we will now start to work on North America already. With the custom tool received by Richard Marsden, we are hopeful to get that covered maybe in time for World Routes, for sure until next Routes Americas. Having the solution for the most complex of our algorithms (thanks Ori) we are also pre-computing the impact values for each airport from the municipality-view. As in most cases the passengers have not just one airport, but optional others to choose from. Depending on the size of the airport, the drive time to get there as well as the flight services offered. But yes, it is quite a bit work and even computerized a real lengthy task to apply these algorithms to all the airport-municipality pairs…
For the maps, we now need to check “low cost solutions”, looking into Google (no “freebees” as Bing), offline mapping tools and maybe Open Street Maps. We assume this takes another 4-6 weeks minimum and we might have to use “offline mapping” as a work-around, with map-creation taking some additional “non-automated” time.
Without the admin borders, we think about a solution to quantify the passenger potential by municipality, thus making “hot spots” visible. Also something to keep us busy, but the benefits of not needing the municipal borders in the display justifying for that. We also got the funding to do a real good prototype of the dashboard, but it takes time to write the necessary software requirements specification.
 Then we have to find a web-agency that can do it (the famous needle in the haystack problem). But without map(s), the dashboard is incomplete, so there must be some “placeholder” while we create the map(s). All those tasks we now have to do on our own finally summed up to the painful decision to reschedule the development plans and skip Routes. Which was especially hard on Jürgen to convince, who is a great fan of that event. We do hope you can understand the reasoning behind our decision and appreciate your feedback – supportive, critical, honest. And if you have ideas how to speed up our agenda, if you have reference to a real good web-agency, you are very welcome! Just a little bit
Thanks Ori for the speedy answer!
Whoever gets me the result first in a way I can use it (calculate “percent” based on variable Z and time) can select either a dinner or a 100€ Amazon (or other online available) voucher. We need a curve calculation, fitting the following requirements…
The curve must not meet the X-Axis, so Y (percent) must always be larger 0, no negative values. At minute 30, the percent value should be 100. Or at minute Zero, then we simply add 30 minutes 😉 Depending on variable Z value, the curve shall slope faster or slower, but “reversed proportional”, the lower Z is, the faster the curve falls. Target values…
* 10% or 20%, but preferably not more! But the curve bending should be variable based on Z within that rough frame. If we have the curve, we need to calculate the coordinates, so percent (with min. two decimals), at given X minutes. We “know” minutes and the variable Z.
|
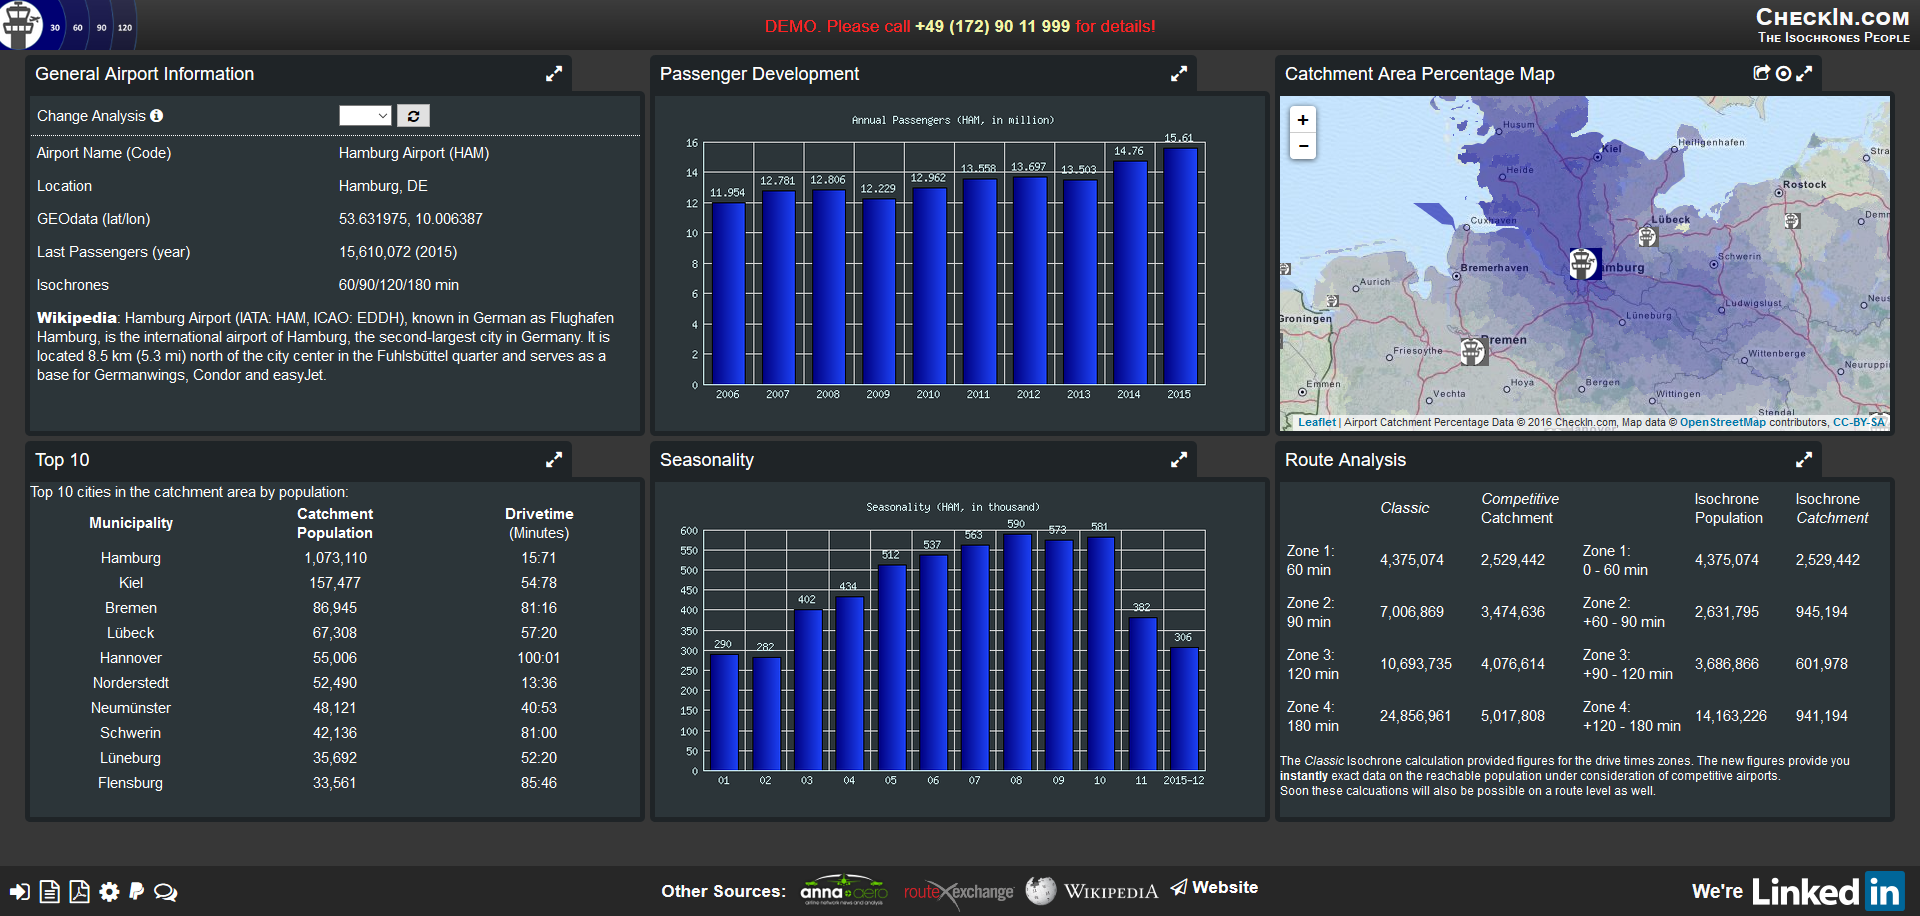
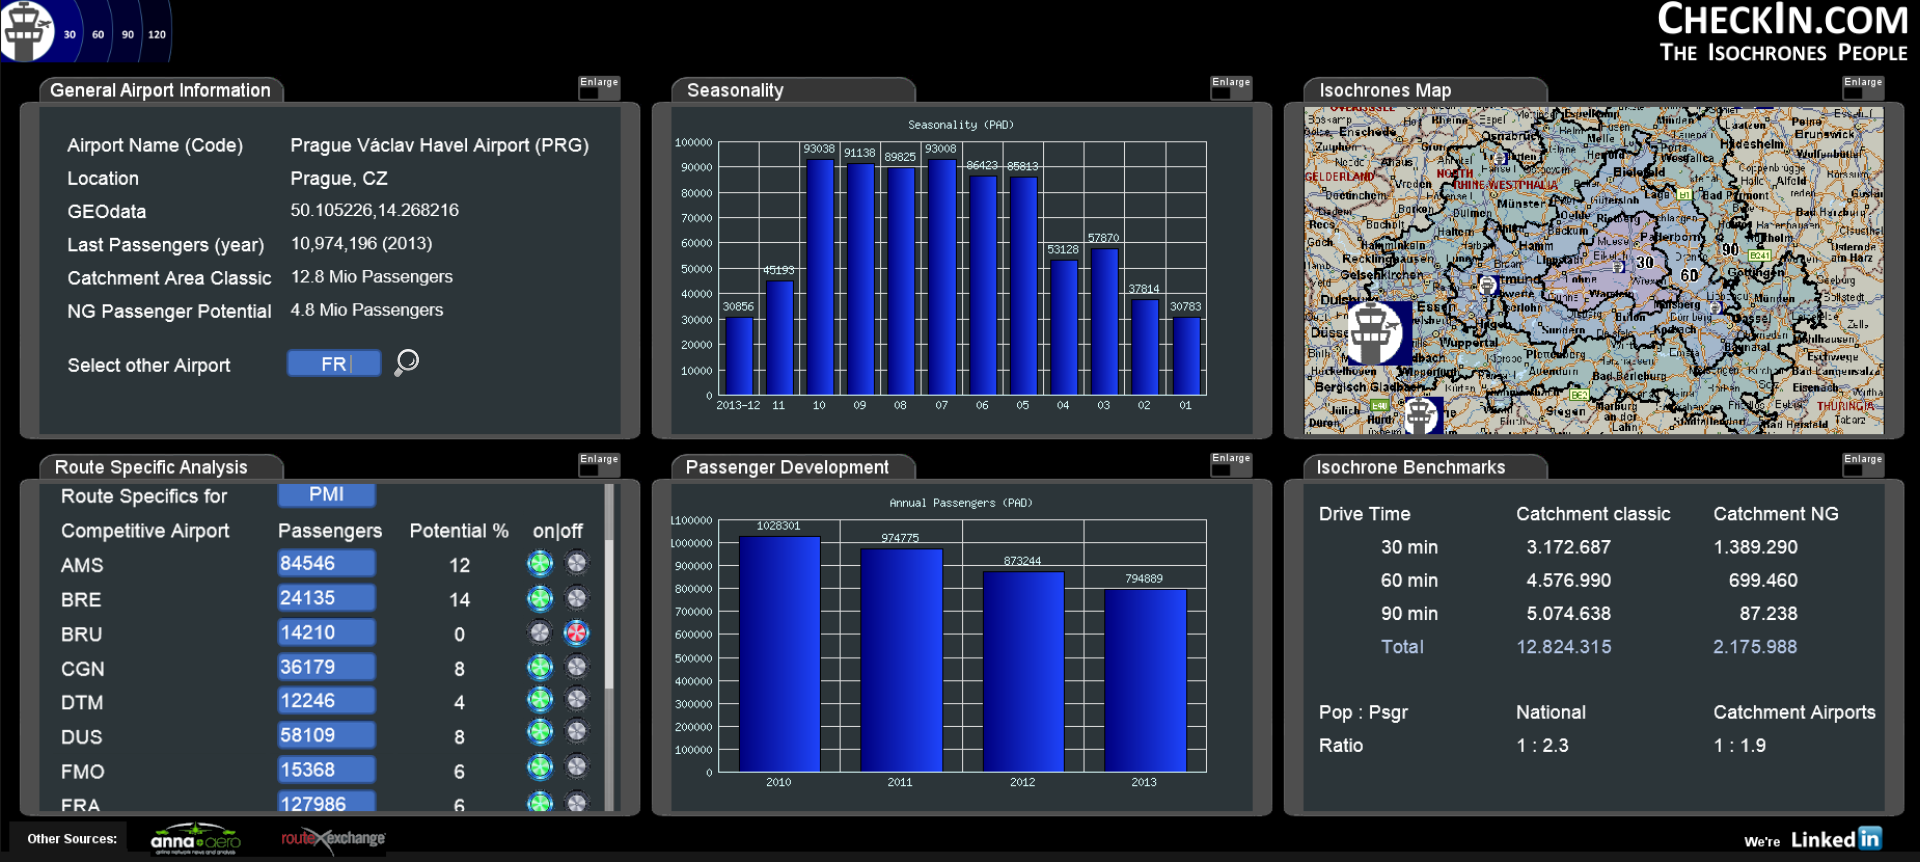
Important News: Help us evolve our analyses from PDF (with map-image) to instant, web-based access (including export for further use!). Join our crowdfunding at Indiegogo and spread the word please! |
 |
[Update: Crowdfunding ended]
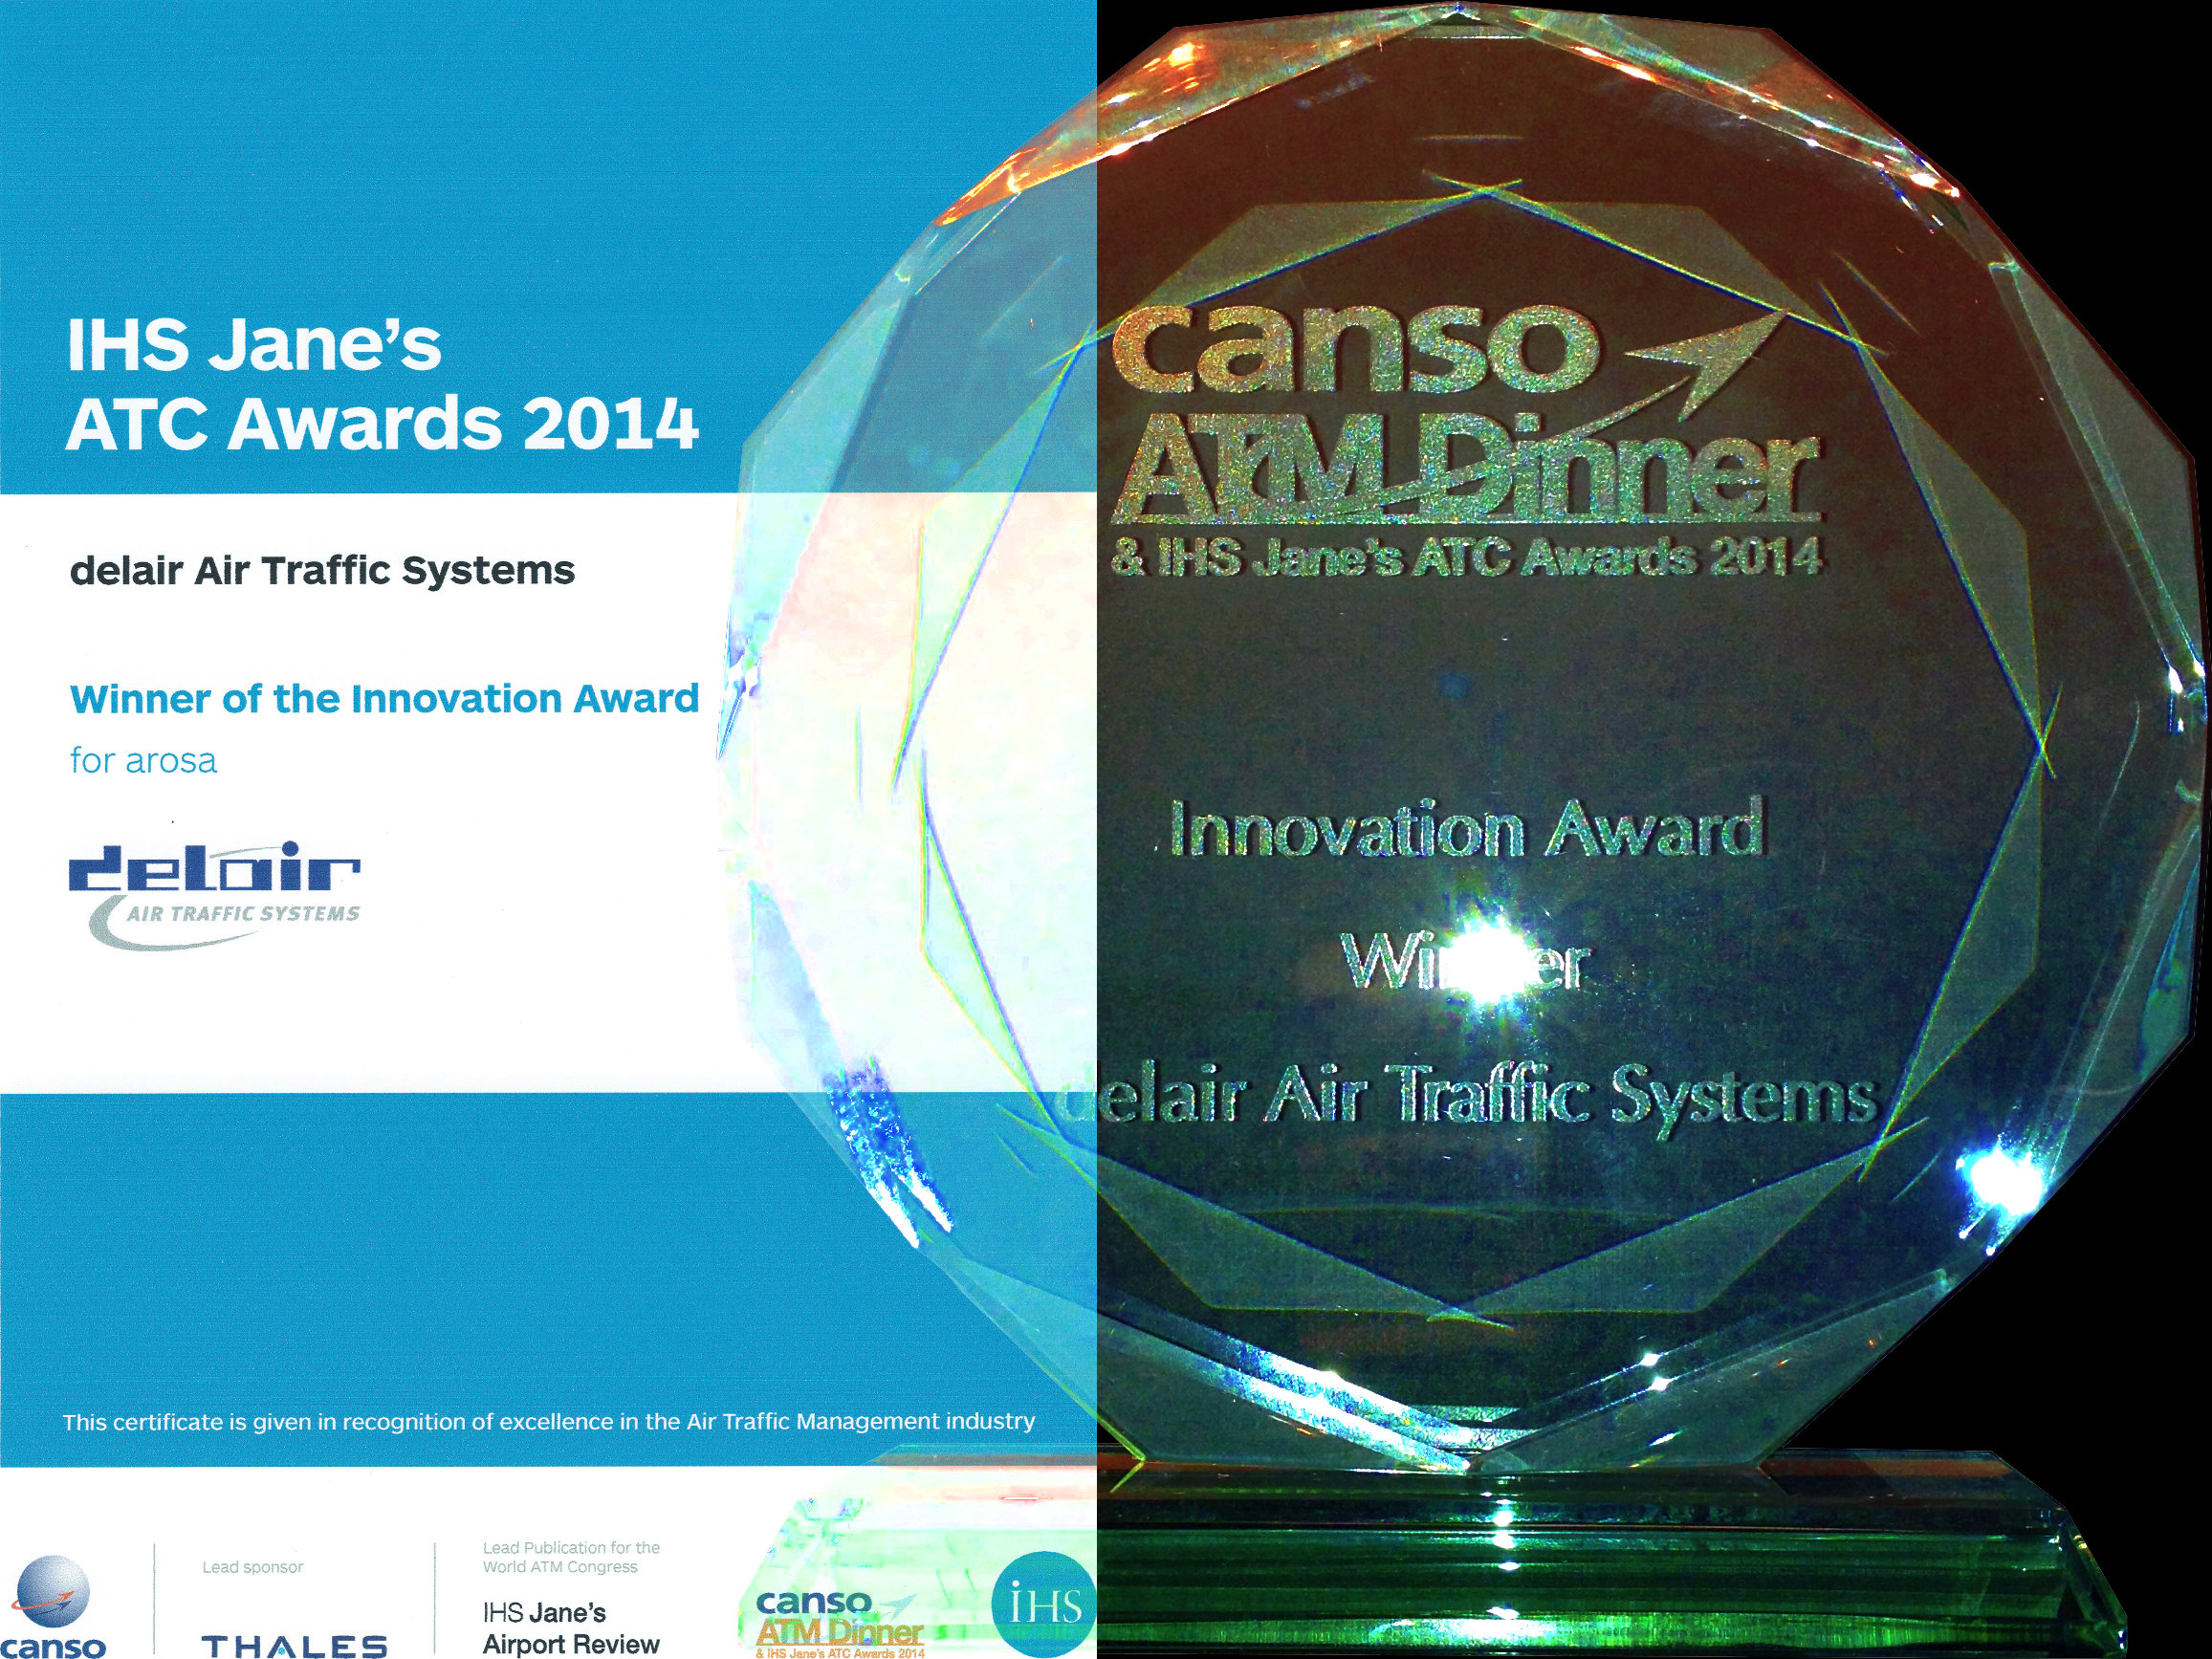
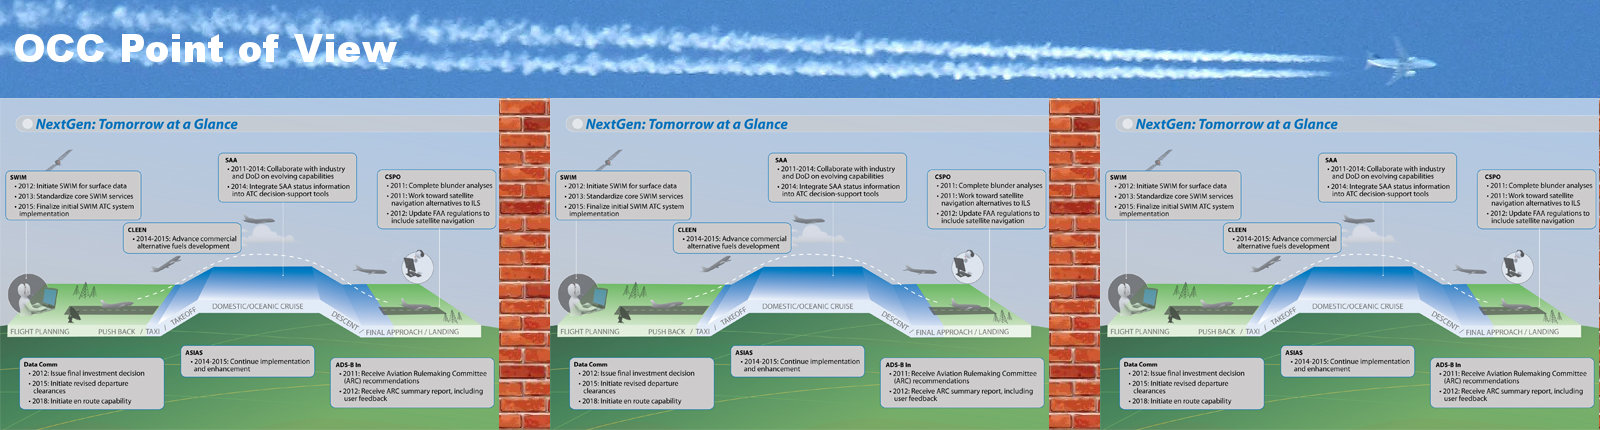
Returning from World ATM Congress in Barcelona (with the IHS Jane’s ATC Innovation Award in my baggage!), I think it’s time to address some feedback on an issue that I keep discussing in LinkedIn and elsewhere: The need to “link” the Airlines Operations Control Center (OCC) and the APOC (Airport Operations Center), the latter being a vital part in A-CDM.
Unfortunately, I see it happening frequently that these “control centers” live in their own little universe with little to no links to their peers. Talking about “Big Data”, Sabre as well as Amadeus and Travelport are “big data players”, though in danger to keep the silo thinking up too long.
Where Sabre once brought global e-Commerce to aviation, back in the 60s, back in the mid-80s, we installed the first Sabre Terminals in European travel agencies, aviation now stumbles behind on the possibilities of global e-Commerce, thanks mostly to technical limitations. As no-one wants to invest… If AA wouldn’t have invested at the time, where would we all be today? But is TPF (Transaction Processing Facility) still the core of our being? Or is it time to move on?
“When we are taught aviation at university we get the impression of how advanced aviation technology really is. When we start working, we are at awe, how little common sense or state-of-the-art is applied in aviation technologies.”
[a student at DLR German Aerospace Agency I recently talked to]
Some keywords what I mean to address here are definitions such as A-CDM (vs. CDM) and Departure – or concepts like Collaboration or Rotation
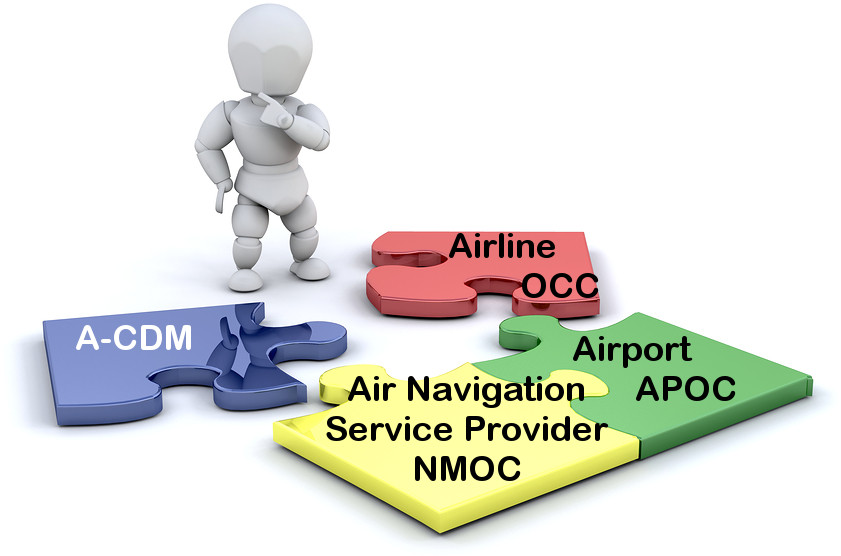
What is the difference between an Airline Operations Control Center (OCC) and an Airport Operations Center (APOC)? And what about the Air Traffic Control’s Network Management Operations Center (NMOC)? And where is the “collaborative aspect” in these?
Right now, they are just three different data silos and collaboration, where it exists, is on a very small local level.
The OCC focuses to limit the negative impact any disruptions have on the operation of any single aircraft in the fleet. The OCC is – so far – the only point that has a rotational point of view, looking at the entire rotation of the aircraft and trying to minimize the impact of disruptions not just on the flight in question, but for all the ones following that particular “segment” (flight A to B).
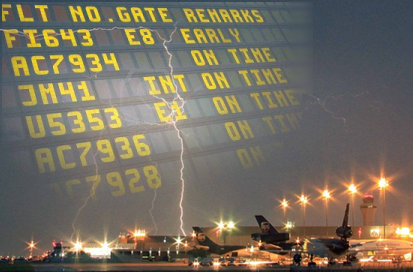
 With increasing legal demand to reimburse passengers on late or canceled flights beyond the value of their net fare they paid, this is were money for the airline is burned. And impact of disruptions and delays at the airport or in the air space may be a nuisance for the work at the airport or the air traffic controllers, but they have a commercial impact on the airline:
They are expensive.
Nevertheless, I seem to be rather alone in that point of view in discussions. Yes, there is an intellectual understanding at airports and ANSPs, but I have a gut-feeling, that it does not “compute” there really: Or why is it, that many ANSPs are not having their representative in the APOC? Not to talk about direct links yet. Or in the OCC? Or why do many APOCs not have direct (data) links to the OCCs of even their most important airlines?
 One discussion a few days ago addressed the definition of “departure”. And it is such a basic difference in definition, it hit me like a hammer, making me understand the impact of that different perception! When air traffic control talks about departure, they talk about the take-off of the aircraft (ATOT). When the airline and airports talk about the departure, they often talk about the time, the aircraft leaves it’s parking position at the terminal or on the apron, the off-block-time (AOBT). I had trouble, understanding, why an airport should invest into a “Pre-Departure Sequencer” instead of a DMAN in the delair-definition. The difference is based on the same subtle misperception of departure. The PDS and most “DMANs” out there focus on the TOBT, taking somewhat into account the delivery of the aircraft “in time” to the runway. Based on a rather “static” assumption of ATC capacity. The DMAN in delair perception optimizes the “real” departure. Taking into account minimum separation of aircraft, depending on the Standard Instrument Departure (SID) route and other highly complex parameters, the DMAN calculates the best TOBT. Thus, no matter the general disruptions at the airport and the real throughput on the runway by ATC, it delivers as many aircraft as possible for departure. That maximises the throughput and in turn minimizing the recovery time after general delays or disruptions.
All that though happens at the given airport, i.e. Zürich. Talking with airports about departure management, the issue is about always that ATC (the ANSP) does not participate in the departure management, does not provide the needed information and – heresy! – how could we just imply that we could sort out the sequence for the air traffic controller? It works in Zurich? Heresy!
Is A-CDM not an FAA and Eurocontrol requirement? Burn it at the stake!
The impact of the aircraft rotation and why A-CDM is something airlines should consider linking OCC to APOC, consider to spend time though the ANSPs who initiated the entire process are the ones stumbling behind their once shining visions of collaborative approaches:
Because the ANSP thinks in “Silo” and leg (flight from A to B).
A friend just recently told me about a major market, offering free access to the excellent flight-data for all flights within the region to the ANSP of a neighboring region, giving this to be offered in reverse to them. The neighboring ANSP (smaller) is not interested, the data is for sale. And they don’t see the additional value having access to the live flight data offered to them. Excuse me? That is Silo thinking.
And that is, why aviation technology today is way behind other industries. Because there is still silo-thinking. “Collaborative Decision Making” is a nice concept, but it fails real life on a large scale for the narrow-minded thinking of the people who’s job it would be to push the idea! It’s not about the bigger picture, but simply about own benefit. People call that “Greed” and it’s a mortal sin.
Food for Thought
Comments welcome
Aside other sources, I copy the content of that news with kind approval of Momberger Airport Information:

Passengers travelling with British Airways through London Heathrow Airport Terminal 5 have begun to test the personalized digital bag tag being developed by the airline. Microsoft Employees have been chosen to take part in a month-long trial, using a specially adapted version of the British Airways app, to provide essential feedback that will help shape the final product. The digital bag tag, which contains all of a passenger’s baggage details, could eventually replace the need for a new paper tag for every flight. Comprehensive testing of the tag has already taken place to make sure that it works in a live airport environment and can stand up to the rigours of airport baggage systems and everyday travel. Customers on the trial will use a Nokia Lumia Windows smartphone to check in, chose their seat and obtain their mobile boarding pass. Each will be equipped with a specially adapted version of the British Airways app, which automatically updates the digital bag tag with a unique barcode, containing new flight details and an easy-to-see view of their bag’s destination – just by holding the mobile phone over it. They can then save time by quickly dropping their bag off at a dedicated bag drop desk, before going straight through security. The personalized digital bag tags have been specially developed by British Airways, in partnership with Densitron Displays, and Designworks Windsor. #963.AIT4

These news upset me as much as the one I read about Amadeus trying a bag tagging based on 3G-technology. Or Air France and other airlines introducing “home-print” bag tags.
As I mentioned two years ago in my little article about a possible check-in-scenario for 2015, I would see a far more reasonable approach (and easy/fast to bring to market) by the aviation industry to use established standards. Why do they use a QR-code with a modified layout? Anything to hide? Or simply to do it different? Which by the way equals “more expensive”, faulty and slow. And – worse of all: Incompatible like VHS and Betamax…

Why do they try to implement and sell expensive, non-industry-standard-compliant stuff here? Why not using existing and proven technologies like RFID or the newer (but to be standard) NFC? Why force me to use an “App” (and where can I get online when being abroad?) or even worse, an expensive 3G-Network technology?
In addition to my (somewhat delayed) prediction about Check-in 2015, I’d also like to see a common free airport WiFi system; wherever an airport offers free WiFi, it’s a common log-in worldwide. Maybe even the same for inflight, just a quick cost note if not free. Or at least a common log-in-process. Enabling to register “globally” is an added value for the Jet Set. And would encourage safer WPA2-connections. “CDM” in action – across aviation industry stakeholders 😉
I’m allowed to dream, right?
The last weeks I was traveling a bit more. And while I attended WinterOps Canada, my boss was at Inter Airport Europe to promote our solutions jointly with our partner UFIS Airport Solutions. Coming back from Canada, I attended the renowned international TAM Symposium, taking place in Braunschweig, where I currently live.
Making new friends in Vancouver, it was my pleasure to also strengthen my friendship with Etienne at TAM Symposium, meeting also wonderful people like Tom, Johan, Anne, Erica, Louise, Kris or Hamsa, just to name a few – you know who you are 😉
One of the core results of these past two weeks is quite frightening. After years of promotion of A-CDM in Europe, there is only a handful of people who understand what A-CDM is all about. Even the experts at TAM Symposium reduced CDM (Collaborative Decision Making) to the sending of DPI-messages (Departure Process Information) to the Eurocontrol NMOC (Network Manager Operations Center). “Eight Airports have established A-CDM”…
As we promoted lately in a press release, Zürich became Eurocontrol CDM compliant (number nine). After doing CDM for more than 10 years, that was newsworthy… Because only now, it counts…?
Though if that is true, if it only counts when the data is linked to the ANSP (Air Navigation Services Provider, Air Traffic Control) why is it always a problem to get the ANSP into the APOCs (Airport Operation Centers) being developed?

As I had expressed before, A-CDM is so much more than what most people, even the experts understand it to be. It is not just a concept to share data, but to work together for a common improvement, making sure everyone pulls on the same rope…
Now the makers of the TAM Symposium even add onto it, promoting TAM, Total Airport Management 😮
So what is TAM? Where CDM is mostly focused (so far) on the airside to improve airport processes, TAM adds the landside. Which is by the way, what Meta-CDM is all about as well, right Alison?
Again, if I search for “Total Airport Management” on the Internet, I get a ton of different explanations what TAM is… or is supposed to be? Even from companies who have been attending the TAM Symposium since it first started. Be it DLR, Eurocontrol, Wikipedia or Siemens. If I then turn it to a global scale and look at CDM or TAM, I could start crying.
“And discussing TAM and CDM, one of the key findings was that no-one understands what these developments are all about.”
As Etienne expressed in his short presentation, the main issue – and mostly the missing link – in the end is “The ‘C’ in CDM”. It’s about Change. Complexity. Cloud. Collaboration. Communication. Many things, but mostly not about Collaboration (as the definition says), but about Change.
Change from a holistic data model with data residing in independent silos, towards a “cloud computing”, where you share the data and the players benefit from the collaboration of data, making sure everyone at any time has the same information at hand. Actually, that reminded me of a presentation of my dear friend Richard, who I quote in the header of this blog, which dates back into 2002 … The underlying concept he raised even as early as 1996!
It is frightening to think that in aviation, the airline, airport, ground handler and air traffic control work – to date – with different data. Supposedly the same, but there’s no guarantee for that…
So do we need to promote “TAM” or “CDM”? Or should we simply start to promote to use state of the art concepts such as “cloud computing” for the benefit of all players?

One of the questions that came up in the event was “Who owns the data”? And that is already the wrong question. No-one “owns” the data in a cloud. But by sharing, the quality of data is improved for the benefit of all – if you start of with an assumed value, whoever has the real value first, will amend the information, accessible seamlessly to anyone.
Once the pacemakers in global e-Commerce, enabling global flight booking in the 60’s long before “Internet”, the aviation industry has lost its bite long ago, stumbles behind.
To make CDM or TAM happen, we need to change. And change is (always and everywhere) a major problem. And we should start to think beyond our petty sandboxes, about the benefits of accurate data and how we can work together to a mutual benefit.
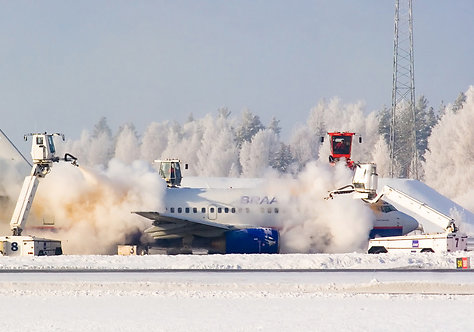
Another question that came up, was about the missing of airlines in CDM-development, they being the main beneficiary of the process. Which is right. If Zurich can now accurately forecast the delays and cancellations caused by winter operations, Zurich can inform the airlines operating flights inbound to Zurich in time to possibly cancel that flight, due to weather, ensuring this particular aircraft aside of that flight stays on-time in its rotation (its daily or weekly operations plan) and does not get stuck in Zurich with a three-hour delay. In reverse, easing the situation for the situation at Zurich.
As a result, the flight cancelled, no passenger compensation will be paid for it or the following flights the aircraft is planned to operate. The resulting cost is lower than if the flight would go without such warning and gets stuck at Zurich.
So yes, the airlines benefit from such development and it is a great pity that they do not understand that. Though as mentioned in my last post, when flying to Vancouver, BA and AA were unable to issue the boarding pass for the next flight segment. So even within the Oneworld Alliance, they seem incapable of sharing the necessary data.

Now looking back at Richards presentation 2002 (and several before then) and comparing to what Hamsa Balakrishnan of the MIT said in her presentation at the TAM Symposium, I somehow feel reminded of good ol’ Don Quixote.
So let’s keep fighting those wind mills 😀
Food for Thought
(comments welcome)
Update: Following link failures, the files are now linked locally. The original links are:
delair Press Release on Zurich Airport A-CDM (2013)
Richard Eastman @ MIFNET 2002
Hamsa Balakrishnan @ TAM Symposium 2013
Etienne was hired by SITA in Spring 2015
UFIS A/S has been acquired by Amadeus in 2014