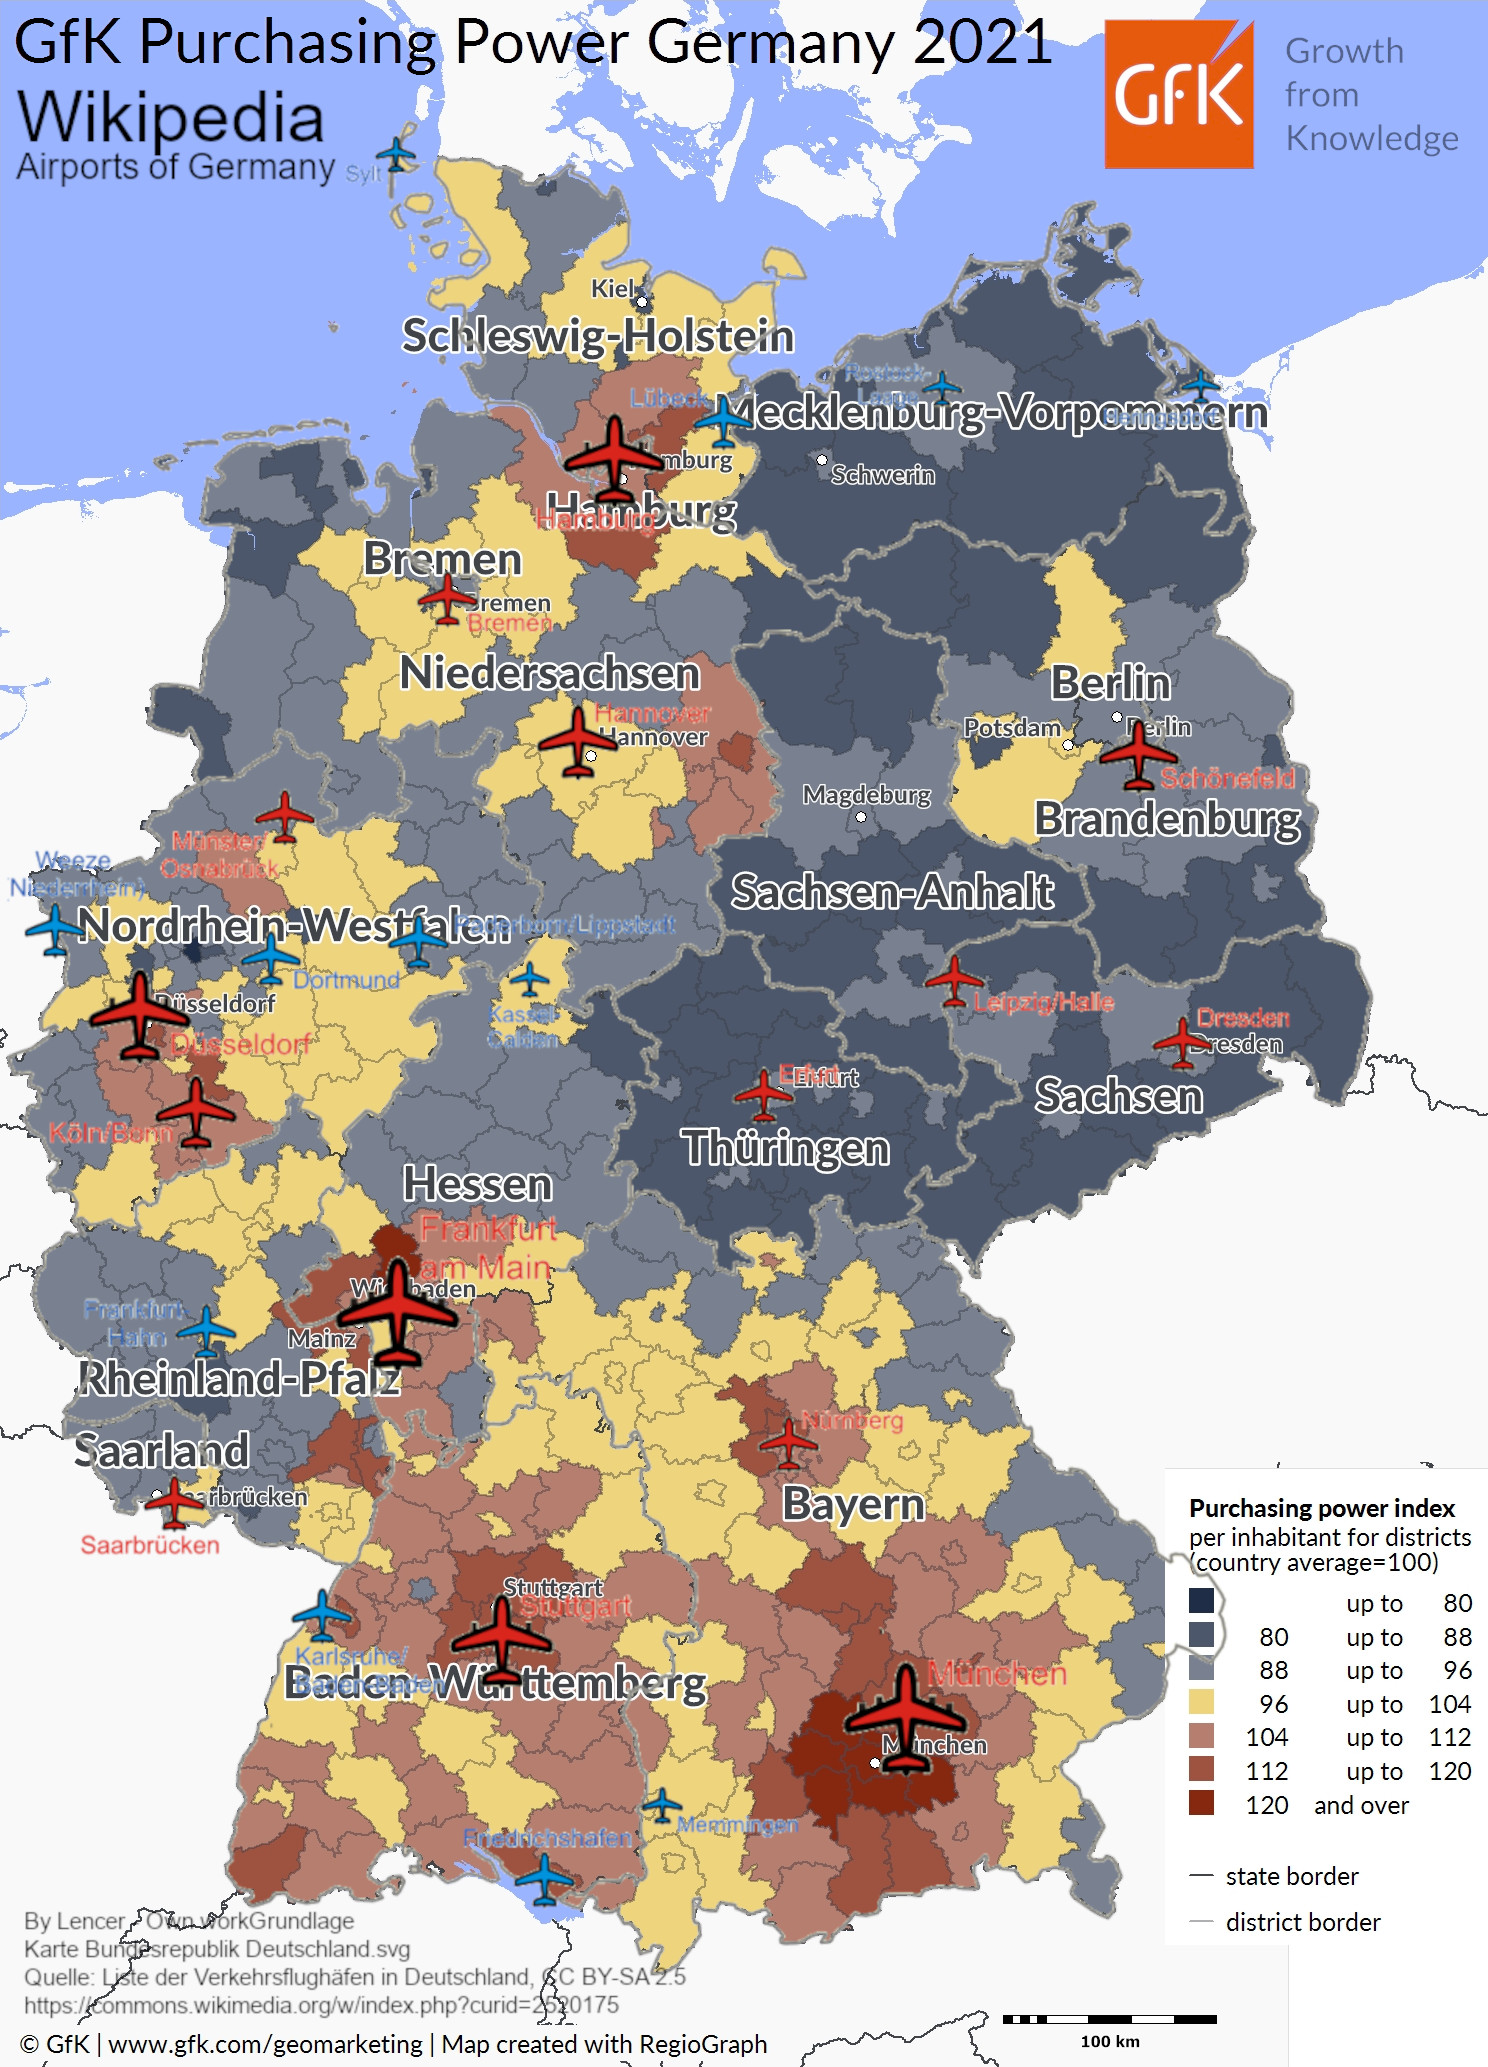
For many years, I use a graphic overlay in Germany in my presentations. I think it speaks for itself.
The influence on airports to purchasing power. Yes, it’s a hen-egg question, but a fact that politicians should think about. Here’s the latest. May it be useful for you too…

Sources: gfk.com + Wikipedia
Map updated Feb. 2021
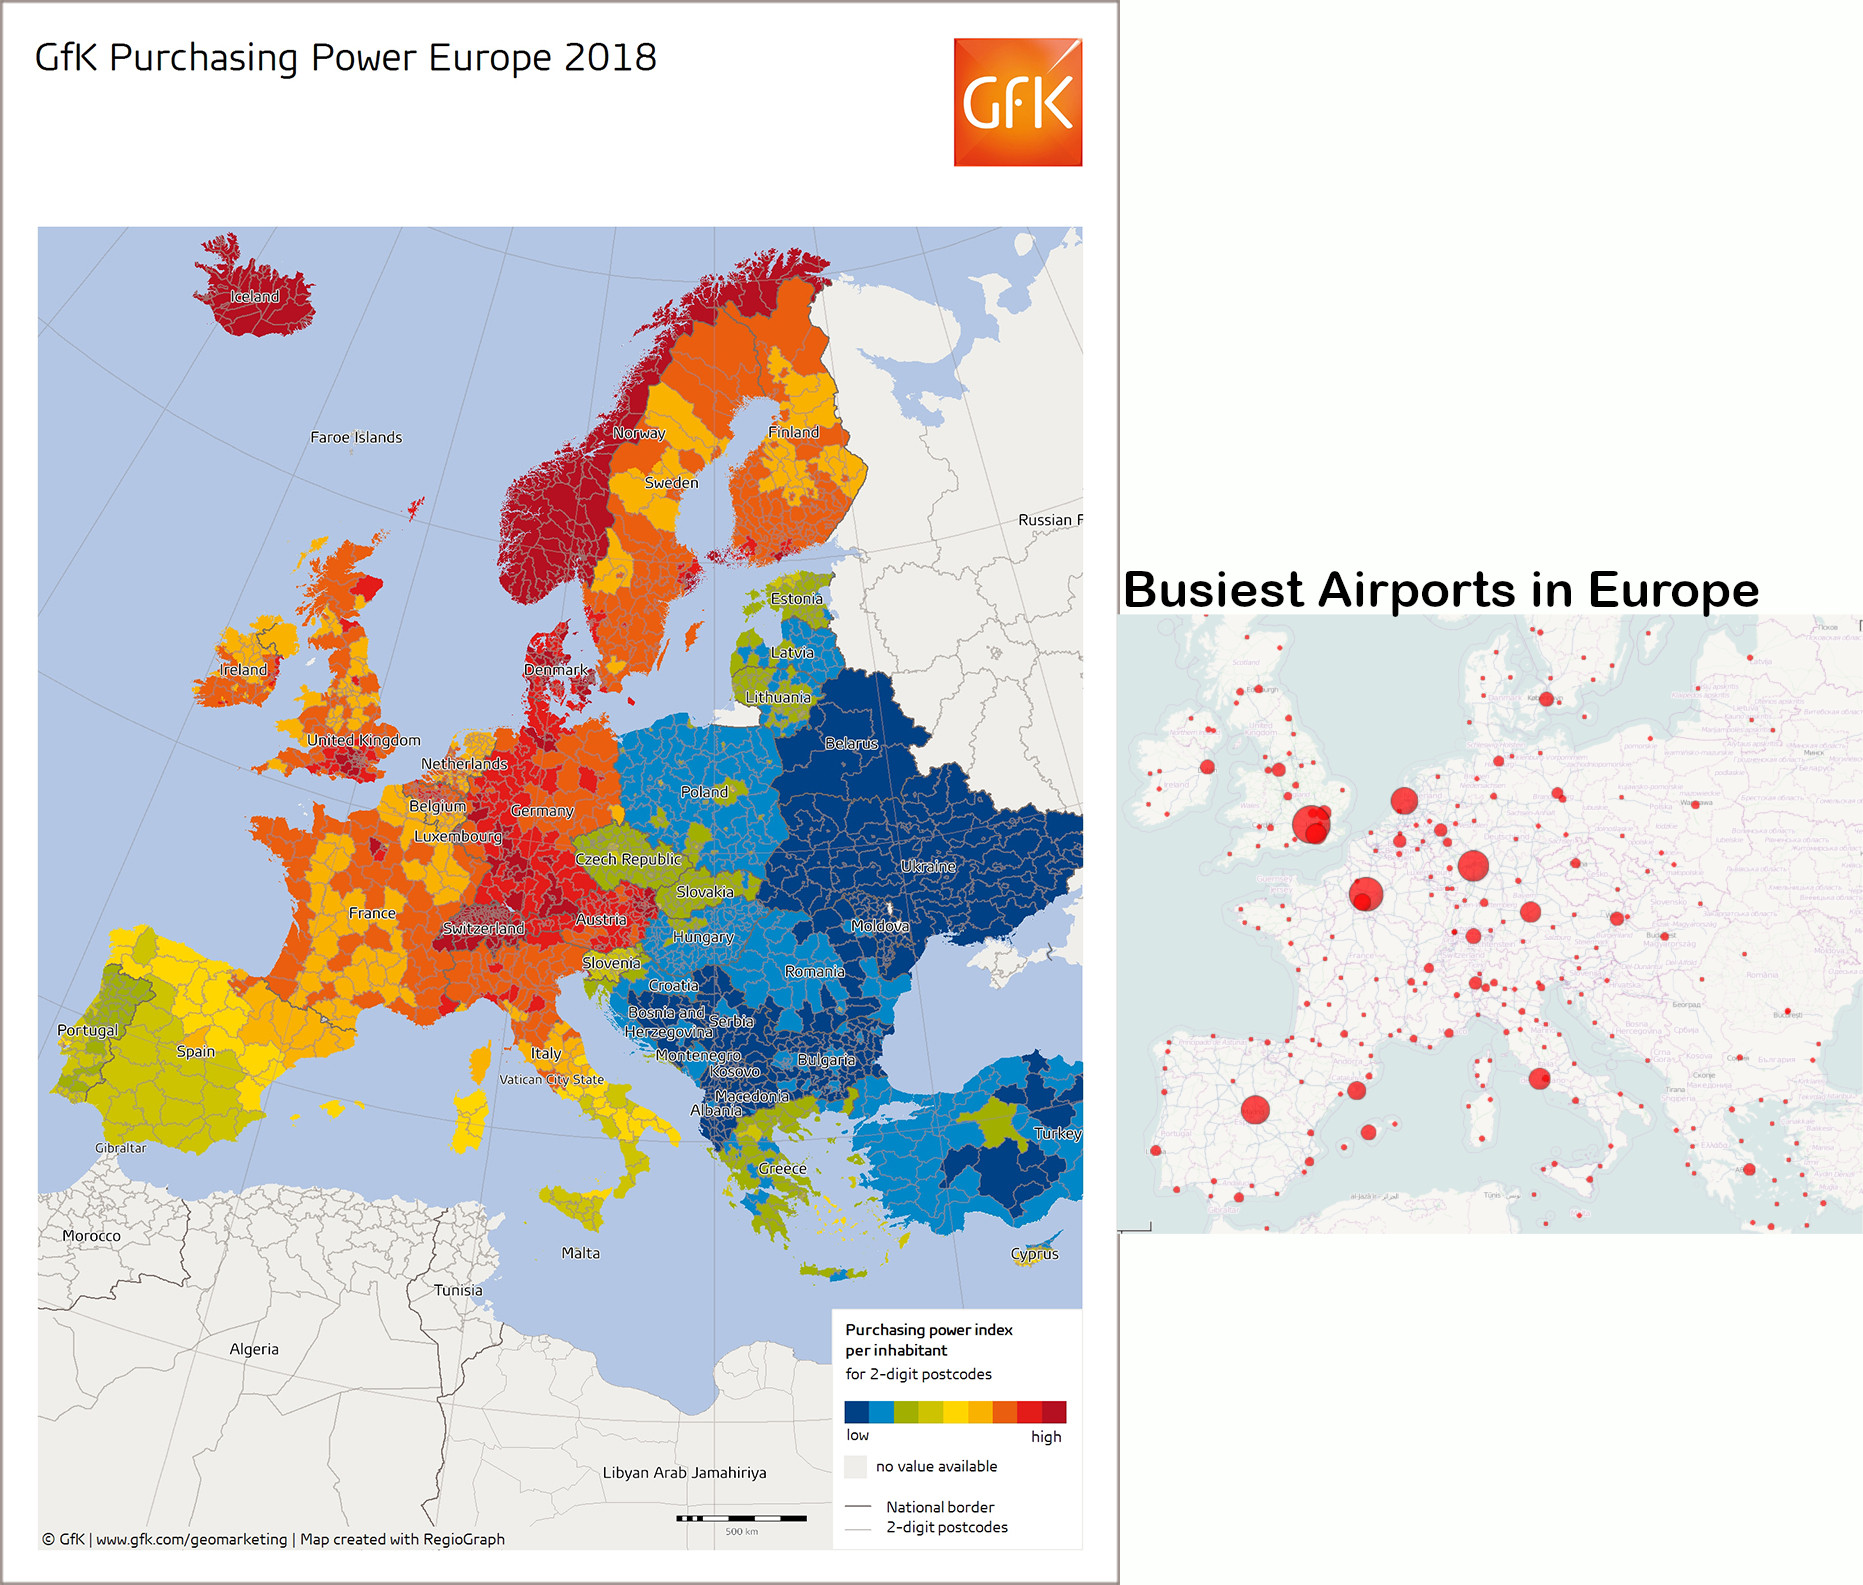
P.S.: Europe
Again, I’ve been asked many times, why I use the German map and not the European level. Unfortunately, for the European Map, the sources use different axis to look at Europe, so I couldn’t get the overlay done. It is much easier on a “national level” and my home country is Germany and Kolibri in Albania currently only contains one airport… On EU-level, the purchasing power is very rough, not reflecting the airports’ “local impact” to the economy.

If you want to have a look at the national maps of GfK, national maps are available for many European countries, I think most if not all of the EU28. Should you need help to create a rough overlay, I’m happy to help, but will charge for it.
CheckIn.com GfK Map Layer
I had the idea long time ago to use CheckIn.com data, being based on OSM, to overlay with the GfK map for Europe, but could not get this done myself, so it would be involving substantial cost licensing the GfK data for a GfK layer and to implement that into the CheckIn.com maps, but that cost is and was not sponsored by anyone.
Yulia would be happy to take it up with GfK and make you an offer. GfK charges € 500 to € 2,000 per country per user – per year. Europe “complete” is offered at € 16,000. Per year! 2016 they did imply in a personal contact the possibility to use the data in CheckIn.com. To implement the data into CheckIn.com, Yulia assumes another € 1,000 for CheckIn.com’s MapMagician to develop the layer. Can be more if the data does not compute with our OpenStreetMap (OSM) compliant data sets. But in total not more than € 20,000 Yulia assumes. Contact Yulia (at checkin.com) if you’re interested to sponsor the development.